Multi-Sine EIS for Early Detection of PEMFC Failure Modes
 Patrick Fortin1
  Thomas Holm
- 1New Energy Solutions, SINTEF Industry, Trondheim, Norway
- 2Institute for Energy Technology, Kjeller, Norway
- 3Mathematics and Cybernetics, SINTEF Digital, Trondheim, Norway
Electrochemical impedance spectroscopy (EIS) is a powerful technique that can be used to detect small changes in electrochemical systems and subsequently identify the source of the change. While promising, analysis is often non-intuitive and time-consuming, where collection times of a single EIS spectrum can reach several minutes. To circumvent the long collection times associated with traditional EIS measurements, a multi-sine EIS technique was proposed in which the simultaneous application of many frequencies can reduce the acquisition time to less than a minute. This shortened acquisition time opens the possibility to use multi-sine EIS as a real-time diagnostic tool for monitoring the state-of-health of commercial fuel cell systems. In this work, a single-cell proton exchange membrane fuel cell (PEMFC) was characterised using multi-sine EIS, by establishing steady-state impedance response under baseline conditions before systematically changing operating conditions and monitoring the dynamic changes of the impedance response. Our initial results demonstrate that full multi-sine EIS spectra, encompassing a frequency range from 50 kHz to 0.5 Hz, can be collected and analysed using simple equivalent circuit models in 50 s. It is shown that this timeframe is sufficiently short to capture the dynamic response of the fuel cell in response to changing operating conditions, thereby validating the use of multi-sine EIS as a diagnostic technique for in-situ monitoring and fault detection during fuel cell operation.
Introduction
Since their introduction and commercialization in the 1990’s, fuel cells have gradually developed into an option for carbon-neutral drivetrains for transportation applications, as well as for stationary power applications and for use in combined heat and power systems. Currently, several companies are making modular stacks of hundreds of kWs (Ballard Product Data Sheet: FCWave, 2021; EKPO PEMFC stack module NM12 Twin, 2021; Nedstack PemGen MT-FCPI-500, 2021; PowerCell PowerCellution Marine System 200, 2021). Heavy-duty transportation and maritime applications have recently been considered the most viable option for the use of fuel cells, and various demonstration projects are underway around the world (IEA, 2019; Baumann et al., 2021). With these developments, fuel cell lifetime has become a key limitation to large-scale operation as current fuel cells designed for heavy-duty transport applications have a nominal lifetime of approximately 20,000 h (MoZEES, 2020). Significant efforts are now underway to extend heavy-duty fuel cell lifetimes even further, e.g., more than 40,000 h by 2030, to reduce the total cost of ownership of fuel cell systems as replacement fuel cell units are expensive. Although degradation is less pronounced during steady operation, the rate of degradation increases significantly during dynamic operation and operation at high current densities (Fletcher et al., 2016). In addition, leaving the fuel cell at open-circuit with delivery of fuel or frequent start-stop sequences will also lead to accelerated degradation (Reiser et al., 2005; Baroody & Kjeang, 2021). Fuel cell monitoring is becoming an important aspect of operation of large-scale fuel cell systems, in which it is desirable for the monitoring techniques to determine the state-of-health of the fuel cell, and provide information about optimized operation strategies to minimize degradation (Wu et al., 2008; Rodat et al., 2009; Onanena et al., 2011; Reid et al., 2013; Fletcher et al., 2016).
Degradation can happen at a combination of slow and very fast time scales, down to less than tens of seconds, for example due to short-circuit or starvation of the fuel cell stack or individual cells, and up to minutes and hours in the case of flooding, drying and poisoning (Wang et al., 2019a). Therefore, it is desirable that the fuel cell is continuously monitored during operation so that the operator can have information about the stack condition before failure or accelerated degradation. Traditional monitoring of fuel cells consists of measuring the voltage and current over time, along with operational parameters such as temperature, pressure, relative humidity, and gas supply flow rates. While useful, it often lacks information about the processes and can often only determine that failure or degradation is happening and not why. Electrochemical impedance spectroscopy (EIS) has been used to monitor fuel cells to provide some of this information (Yuan et al., 2007; Wu et al., 2008; Rezaei Niya & Hoorfar, 2013). For example, qualitative detection of flooding/drying (Mérida et al., 2006; Rodat et al., 2009; Kang & Kim, 2010; Debenjak et al., 2013; Morin et al., 2013; Chevalier et al., 2016; Depernet et al., 2016; Engebretsen et al., 2018; Shan et al., 2018), mass transport conditions (Cruz-Manzo et al., 2013; Depernet et al., 2016), temperature (Tang et al., 2013), starvation (Migliardi & Corbo, 2013; de Beer, 2014), and catalyst poisoning (Wagner & Gülzow, 2004; Deseure, 2008; Brunetto et al., 2009; Asghari et al., 2010; Migliardi & Corbo, 2013; de Beer, 2014; Reshetenko et al., 2014) has been demonstrated in the literature and highlights the potential of the technique as a diagnostic tool (Yuan et al., 2006a; Yuan et al., 2007; Halvorsen et al., 2020). EIS is done by applying a sinusoidal current (or voltage) signal to the fuel cell stack during operation and measuring the sinusoidal potential (or current) response at the stack or cell level while varying the frequency of the signal. This technique is non-destructive and information-dense, but the interpretation of the response is non-intuitive and puts a high demand on the experimenter. In addition, the response of non-optimal conditions such as drying or starvation may look very similar to normal degradation of the fuel cell, such that it is hard to know the source of power loss in the fuel cell stack. Therefore, it is desirable that the fuel cell is continuously monitored to distinguish these processes at least qualitatively such that the operator can be informed about how to optimize operation. A full measurement of an EIS spectra in the typical range of about 0.1 Hz to 10 s of kHz takes about 15 min (Brunetto et al., 2009). On the other hand, a solution suggested in the literature is to measure only a single or a few frequencies such that the data acquisition for each point take less than 1 s (Lochner et al., 2020; Najafi et al., 2020). The last approach is feasible and fast, but is not able to provide information about several fuel cell parameters simultaneously as they do not capture the entire frequency-range required. Therefore, as a trade-off, it is desirable that the measurement and interpretation time is reduced as much as possible while still having information about all processes, i.e., a full EIS spectra.
Multi-sine EIS, in which several sine waves of different frequencies are added together simultaneously and applied to the fuel cell instead of applying individual frequencies in succession, has been shown to reduce the measurement time by about 70% while providing the same response (Brunetto et al., 2009). The reduced acquisition time makes multi-sine EIS an intriguing option for online monitoring of operational fuel cells. The implementation of multi-sine EIS monitoring methods in combination with rapid analysis methods, e.g., equivalent circuit fitting, distribution of relaxation times (DRT) (Deseure, 2008; Simon Araya et al., 2019; Dierickx et al., 2020), or other simplifications of the impedance spectra (Becherif et al., 2018), and subsequent optimization feedback relays can enable rapid, automated online state-of-health monitoring and optimization of fuel cell operating conditions with respect to degradation phenomena.
Herein, we investigate the feasibility of the multi-sine EIS technique as a tool to monitor and detect changes in the operational conditions of a single-cell PEMFC. First, the multi-sine EIS collection protocol was optimized to minimize collection time, while ensuring the collection of high-quality data. The target acquisition time was set to less than 1 min due to the ability to trace development of the more common degradation methods (drying, flowing, and poisoning) as this happens on the scale of minutes (Wang et al., 2019b). Following the initial multi-sine EIS optimization, the dynamic impedance response under each of the two simulated stressor conditions, cell drying and mild cathode starvation, was measured by manipulating the operating conditions of the fuel cell, namely, relative humidity (RH) and oxidant gas stoichiometry. We show that the multi-sine EIS technique is sufficiently rapid and sensitive to achieve early detection of drying and mild cathode starvation. Due to the speed of acquisition, this technique ultimately has the potential to be used for online state-of-health monitoring and optimized fuel cell performance when coupled with the appropriate diagnostic, prognostic, and control algorithms.
Experimental
PEMFC Cell for Experiments
A 25 cm2 fuel cell hardware with graphitic bipolar plates and a 5-fold serpentine flow field pattern from balticFuelCells GmbH was used for all measurements. PRIMEA® catalyst coated membranes (GORE®) consisting of a PFSA-based membrane (15 μm thick), Pt loadings of 0.1 mg cm−2 at the anode and 0.4 mg cm−2 at the cathode; Sigracet 22BB gas diffusion media (SGL Carbon); and 51 μm thick Teflon gasketing (FuelCellStore) were all used as received. The design of the balticFuelCells hardware separates sealing and contact pressure, as the Teflon gasketing simply acts to support the underlying CCM, while the active area compression is controlled via a pneumatic piston. 3.25 barg of compressed air is supplied to the pneumatic piston, translating to a contact pressure of 1 N/mm2 over the active area of the cell. The fuel cell hardware was mounted to a Greenlight Innovation G60 fuel cell test station and a BioLogic VMP3 potentiostat equipped with a 10 A booster was used to perform electrochemical impedance spectroscopy measurements.
Electrochemical Measurements
Baseline Conditions—The baseline EIS experiments were performed with pure hydrogen (5.0, Linde Gas AS) supplied to the anode with a stoichiometry of 2.0, compressed filtered air (in-house) supplied to the cathode with a stoichiometry of 2.5, a cell temperature of 80°C, anode and cathode dewpoints of 71.4°C (i.e., 70% RH), and 0.5 barg backpressure at both the anode and cathode. All EIS measurements were performed with a DC current of 25 A and an AC perturbation of 1.25 A. Unless otherwise stated, EIS spectra were collected between 50 kHz and 0.5 Hz with 10 points per decade, using a wait time of 0.5 wave periods before each frequency (i.e., 1 s in the case of a frequency of 0.5 Hz), and measuring a total of 3 wave periods per frequency (i.e., a 0.5 Hz measurement takes 6 s + the wait time). These settings allowed for multi-sine EIS spectra to be acquired at a rate of 44 s per spectrum. Multi-sine EIS measurements were performed with the EC-Lab software while the Greenlight test station logged the relevant fuel cell data (e.g., gas composition, gas stoichiometry, dew point, etc.). In the method used by EC-lab, multi-sine signal is applied for frequencies below 10 Hz, up to a maximum of 15 frequencies. In our case, 10 frequencies were applied in the multi-sine mode, from 8.15 to 0.5 Hz. The amplitude for each frequency was the 1.25 A, and the phase of the imposed signal was shifted according to Eq. 1.
Here,
Here, u(t) is the applied signal as a function of time, A is the amplitude (1.25 A), and
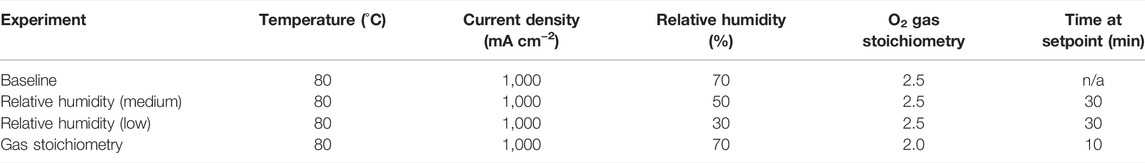
TABLE 1. Table of experimental parameters used in this work.
Relative Humidity—Multi-sine EIS was data was collected under baseline conditions for 5 min, i.e., dew point (DP) 71.4°C (RH 70%), then the DP was reduced to 63.8°C (RH 50%) for 30 min, further again to 52.9°C (RH 30%) for 30 min, and finally the DP was increased back to 71.4°C (RH 70%). The dew points took ∼10 min to reach their new set point and the next 20 min ensured that water balance within the membrane electrode assembly reached an equilibrium before moving to the next dew point. Both the anode and cathode gas inlets were kept at the same DP during the measurement.
Gas Stoichiometry at the Cathode—Multi-sine EIS data was collected under baseline conditions, i.e., cathode stoichiometry of 2.5 for 5 min. The cathode stoichiometry was then reduced to 2.0 for 10 min and increased back to 2.5 for 15 min.
Data Analysis of EIS
A literature review was done to assess the most suitable equivalent circuit models, and a set of 4 equivalent circuits were identified (shown in Figure 1A). In general, the circuits have two or three time constants. In Figure 1A, R is a resistor, C is a capacitor, and Q is a constant-phase element, i.e., a non-ideal capacitor. The 3CR circuit was determined to be the most representative equivalent circuit model for the fuel cell setup used in our measurements. Initial EIS fitting was done using the built-in Z fit protocol in EC-lab which uses nonlinear least square fitting and the Simplex algorithm. For the multi-sine data, processing was automated by building an in-house Python script using the impedance.py package (Getting started with impedance.py, 2021).
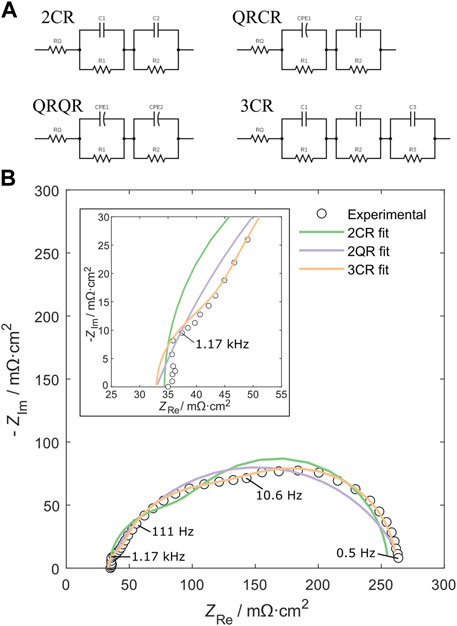
FIGURE 1. (A) Selected equivalent circuit candidates identified from the literature, and (B) a single-sine Nyquist plot recorded at a current density of 1,000 mA cm−2 and over a frequency range of 50 kHz to 0.5 Hz. The experimental data is shown as black triangles, with the 2CR, 2QR, and 3CR fits represented by the blue, green, and red lines, respectively.
Results
Determination and Interpretation of Equivalent Circuit
To interpret the obtained EIS spectra, a good equivalent circuit model is needed. A good equivalent circuit is characterized by obtaining a good fit of key parameters, while simultaneously not be a case of overfitting, i.e., using several redundant fitting elements. Several equivalent circuits have been proposed for PEMFC measurements and used successfully in the literature. These can vary depending on the experimental conditions. For example a low-frequency inductive loop appears at very low frequencies or at low current densities (Cruz-Manzo & Chen, 2013; Cruz-Manzo et al., 2015; Dierickx et al., 2020; Pan et al., 2020). These additional Nyquist plot features necessitate additional equivalent circuit elements to accurately represent the different physical phenomena taking place within the fuel cell. To choose an equivalent circuit, four proposed equivalent circuits based on the literature (Figure 1A) were each fit to the high-quality, single-sine EIS data measured experimentally. To identify the most suitable equivalent circuit, the proposed equivalent circuits were then sorted according to: 1) fit quality, 2) ability to estimate the low-frequency and high-frequency intercepts, and 3) the avoidance of non-ideal circuit elements, i.e., the constant phase element (CPE). The avoidance of a CPE is an important aspect to consider as this element is not a true capacitor, often leading to increased error in the fitting process due to its flexibility as well as a more complex interpretation when estimating the system capacitance. Figure 1B shows the experimental data collected at 1,000 mA cm−2, fitted with the equivalent circuits depicted in Figure 1A. Note that the QRCR fit is omitted from Figure 1B as it gave an identical fit to the 2CR circuit. Note also here that the maximum frequency of 50 kHz is not visible in the figure, as from about 7 kHz and higher, the signal goes into the fourth quadrant of the Nyquist plot and is not fitted because the use of a linear inductor does not provide additional information about the electrode processes. Based on the criteria above, the fit quality (sum of square error function with modulus fit) improved in the order 3CR > QRQR > 2CR. Both the QRQR and 3CR circuits were able to accurately estimate the high- and low-frequency intercepts, but only the 3CR circuit accurately predicted the spectrum across the entire frequency range, i.e., it accounts for the small high-frequency loop (shown in the inset of Figure 1B). For these reasons, in addition to the avoidance of CPEs, the 3CR circuit was chosen for all subsequent equivalent circuit fitting.
Many circuits have been considered in the literature, ranging from more complex circuits that attempt to describe the full system (Fardoun et al., 2017; Giner-Sanz et al., 2018; Pivac et al., 2018) to simpler circuits that are used to interpret changes quickly and only serve as a quasi-measure of system parameters (Cruz-Manzo et al., 2013; Depernet et al., 2016; Engebretsen et al., 2018; Mérida et al., 2006; Yuan et al., 2006b). Some authors have also tried to estimate the full EIS spectra from a limited amount of frequencies measured (Becherif et al., 2018). Here, the 3CR circuit is chosen for both its robustness of the analysis and its ability to identify, and separate, key physical parameters. In addition, the 3CR circuit is simple enough to be generally applicable even though the experimental conditions are far from the baseline. The following key elements of the Nyquist plot, and their corresponding equivalent circuit elements, can be attributed to physical parameters of an operational fuel cell: 1) the high frequency intercept, 2) the small high-frequency loop, 3) the medium-frequency loop, and 4) the low frequency loop. These features are all highlighted in Figure 2 as sections in the Nyquist plot. The high frequency intercept of the real impedance axis is attributed to the total Ohmic resistance, RΩ, of the cell, i.e., the sum of all electrical and ionic resistances. In an operating fuel cell, the Ohmic resistance is dominated by the ionic resistance of the membrane and so the high frequency intercept is often used to approximate the membrane resistance (Springer et al., 1996). The appearance of a small, high-frequency loop, whose size is independent of potential, has been previously observed in the literature and has been attributed to the distributed Ohmic resistances and contact capacitances that arise within the nanoporous catalyst layer structure (Fischer et al., 1998; Paganin et al., 1998; Freire & Gonzalez, 2001; Romero-Castañón et al., 2003). The medium-frequency loop can be attributed to the catalyst layer kinetics at the cathode. The equivalent circuit elements, R2 and C2, that can be extracted from the appropriate fitting techniques represent the charge-transfer resistance, Rct, and double-layer capacitance, Cdl, of the cathode catalyst layer, respectively. Finally, the low-frequency loop can be attributed to mass transport-related phenomena at the cathode. The equivalent circuit element, R3, is therefore referred to as the mass transport resistance at the cathode, Rmt. In general, RΩ, Rct, Cdl, and Rmt are among the most important parameters used to indicate the state-of-health of a fuel cell membrane electrode assembly. As such, these parameters will be the focus of investigation herein.
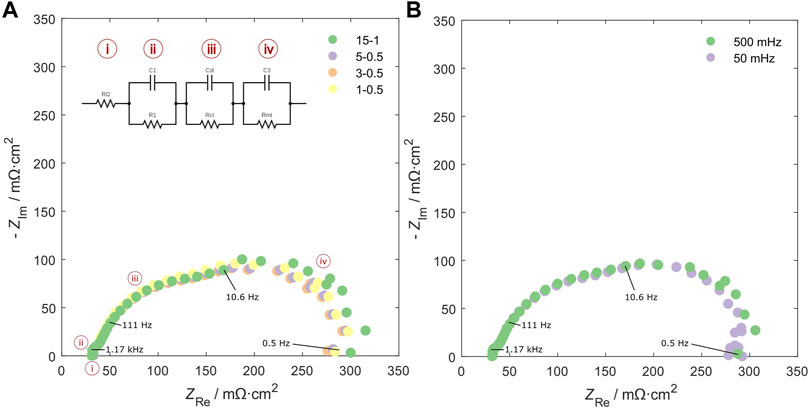
FIGURE 2. Measured EIS spectra as a function of experimental settings; (A) varying the repeating wavelengths, Nrep, and initial waiting time, Nwait. Important Nyquist plot featured are identified: i) the high frequency intercept, ii) the small high-frequency loop, iii) the medium-frequency loop, and iv) the low frequency loop. (B) Measured EIS spectra as a function of minimum frequency, fmin.
Multi-Sine EIS Measurements
When approaching EIS data collection with the goal of reducing measurement time, the most important parameters to consider are: 1) the minimum frequency, fmin, 2) the number of repeat measurements at each frequency, Nrep, and 3) the number of periods before each frequency, Nwait. These data collection settings were varied systematically to find an optimal balance between data quality and acquisition speed. First, a comparison between the single-sine and multi-sine EIS was done to assess the time saving by using the multi-sine technique. These results are presented in Figure 3 with varying number of repeats, Nrep, Nwait = 1, and a frequency range of 50 kHz–0.5 Hz. The time saving is significant, where at Nrep = 15, the multi-sine experiment represents a time saving of 59% (161 s vs. 395 s). As the number of repetitions is reduced, the relative time saving is also reduced to 30% at Nrep = 1. Visually, the multi-sine EIS spectra are noisier at the low frequencies, but this noise is reduced as the number of repetitions are increased, and at Nrep > 3, the noise is small and would not be expected to significantly impact the fitted parameters. The frequency range was chosen as it ensures resolution of both the high- and low-frequency intercepts, ensuring accurate determination of RΩ and Rmt, respectively. While extending the low frequency limit by an order of magnitude to 50 mHz allows for the resolution of a low-frequency inductive loop that may provide insightful information about the hydrogen peroxide formation at low current densities (Cruz-Manzo et al., 2015; Cruz-Manzo et al., 2016) or the interface dissolution resistance in the cathode catalyst layer in a PEMFC (Pivac et al., 2018), the measurement time was approximately tripled. Second, Nrep and Nwait were varied to find an optimal balance between data quality and acquisition speed. Figure 2 highlights selected Nyquist plots in which the influence of the data collection settings can be seen. Although the EIS spectra converge in the high and medium frequency regions of the Nyquist plots, increased noise is observed in the low-frequency region as the number of repeats, Nrep, was reduced. The wait time, Nwait, exhibited little influence on the EIS spectra. The optimal data collection settings chosen to be carried forward in the dynamic fuel cell operation experiments were a frequency range of 50 kHz–0.5 Hz, Nrep = 3, and Nwait = 0.5. These settings allow for collection of a full EIS spectrum in 44 s.
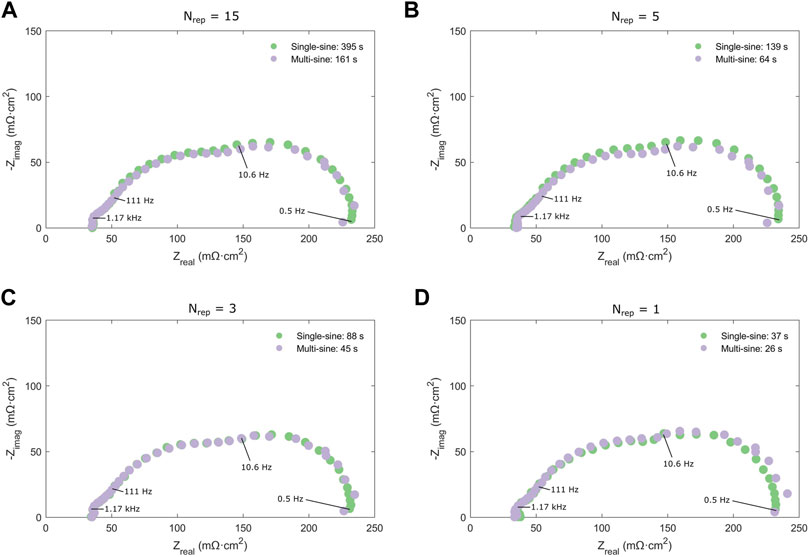
FIGURE 3. Comparison of single-sine and multi-sine EIS with an Nrep of (A) 15, (B) 5, (C) 3, and (D) 1. The total measurement time is indicated in the legends.
Table 2 shows the fitted parameter values obtained at different EIS data collection settings. The parameters further investigated here, RΩ, Rct, Cdl, and Rmt, were all within a standard deviation of the most time-consuming measurements, Nrep = 15 and Nwait = 1, assumed to be the baseline and most accurate measurement in this case. The largest variation lies in the mass transport resistance, Rmt, estimated from the low-frequency loop where the data collection settings seemingly influence the Nyquist plot the most. Additionally, the use of a lower minimum frequency does not improve the fitted parameter value, rather, it can be argued that the small inductive loop can give some uncertainty in the determination of the mass-transport resistance.
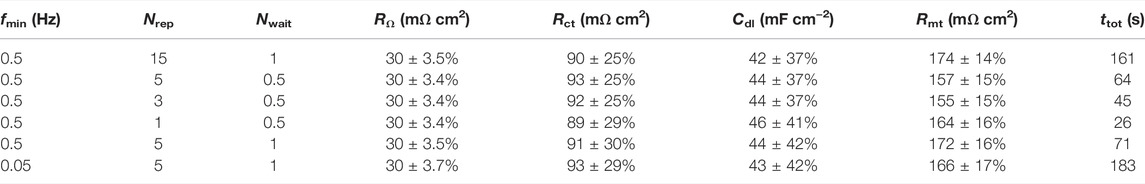
TABLE 2. Fitted EIS parameters for various EIS data collection settings.
Detecting Changes in Relative Humidity
The ability of the multi-sine EIS technique to detect dynamic changes in relative humidity was examined by the continual collection of multi-sine EIS spectra as the relative humidity of a single-cell PEMFC was varied. The values of RΩ, Rct, Cdl, and Rmt were subsequently plotted as a function of time. The relative humidity (RH) was varied in a stepwise manner, from 70%, down to 50%, and finally down to 30%, to investigate how this influences the EIS spectra and the subsequently fitted parameters. Figure 4A shows Nyquist plots collected as a function of RH over time. As RH is decreased, there is a clear shift in all the Nyquist plot features to higher real impedance values. The observed increase in ohmic resistance of the cell, RΩ, is expected as a lower relative humidity will lead to less water content in the membrane, which reduces ionic conductivity within proton exchange membranes (Peckham et al., 2008). A similar effect is observed for the ionomer present in the catalyst layer, that is; under reduced RH conditions there will be less water content within the ionomer and subsequent morphological changes will reduce the triple phase boundary between the ionomer, catalyst, and gas-filled pores (Cetinbas et al., 2020). Furthermore, it has been shown that at low RH values, the oxygen permeability through the ionomer is significantly reduced (Novitski & Holdcroft, 2015). These changes in catalyst layer ionomer properties are responsible for the observed increase in charge-transfer resistance, Rct, through decreased electrochemically active surface area and decreased availability of dissolved oxygen leading to reduced kinetics. The observed decrease in double-layer capacitance, Cdl, can also be explained by reduced surface area between the ionomer and catalyst; and the observed increase in mass transport resistance, Rmt, likely arises from the decreased permeability of oxygen through the catalyst layer and decreased availability of oxygen at the ionomer-catalyst interface.
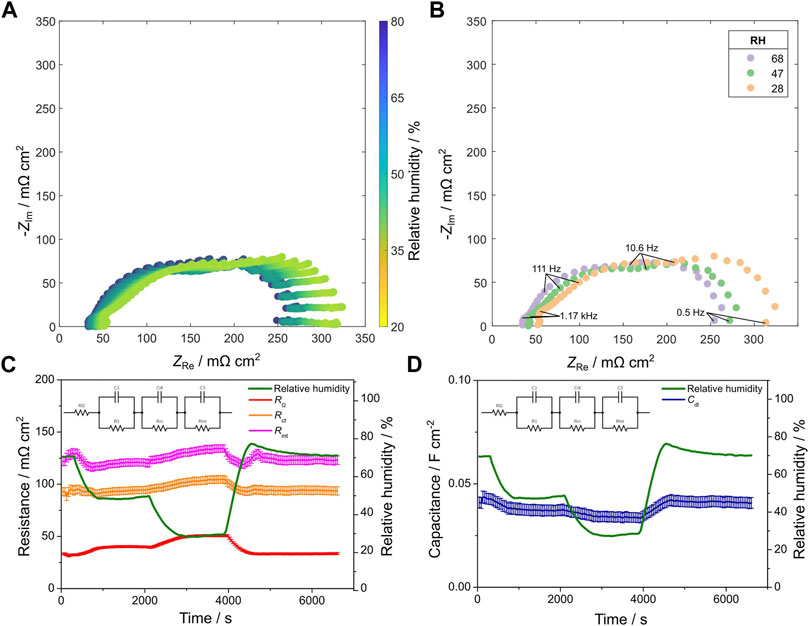
FIGURE 4. EIS spectra and fitted values from changes in relative humidity; (A) Nyquist plot of all measurements, (B) Nyquist plot of selected measurements at the relative humidity setpoints, (C) fitted resistance values and relative humidity as a function of time, and (D) fitted capacitance value and relative humidity as a function of time.
The main highlight of these results is the demonstration of multi-sine EIS as a technique to capture dynamic changes in water balance phenomena. The longer timescale (seconds to minutes) of water transport and equilibration within the fuel cell membrane electrode assembly allows dynamic changes to be captured by the multi-sine EIS technique. This result suggests that multi-sine EIS has the ability to be applied as a diagnostic technique for fault detection in operational PEMFCs, at least concerning phenomena that take place over longer timescales.
Detecting Changes in Cathode Stoichiometry
The ability of the multi-sine EIS technique to detect dynamic changes in oxygen concentration was examined by the continual collection of multi-sine EIS spectra as the cathode stoichiometry of a single-cell PEMFC was varied. The values of RΩ, Rct, Cdl, and Rmt were subsequently plotted as a function of time. A mild change in cathode stoichiometry was performed, varying the set point from 2.5 to 2 and back again. A comparison of the Nyquist plots collected immediately before and after the change in cathode stoichiometry is shown in Figure 5B, and there is a clear increase in the low-frequency loop as cathode stoichiometry is reduced. This observation is confirmed by the fitted resistance values plotted as a function of time, Figure 5C, in which a significant increase is observed for the Rmt parameter, whereas a more subtle change was detected in the charge-transfer resistance, Rct, and no changes in ohmic resistance, RΩ, or double-layer capacitance, Cdl, were observed. The significant increase in the magnitude of both real and imaginary impedance in the low-frequency mass transport loop, and fitted Rmt values, can be explained by the reduction in available oxygen as cathode stoichiometry is decreased. Similarly, the slight increase in magnitude of the mid-frequency loop, and fitted Rct values, is related to the reduced oxygen concentration in the catalyst pore space and gas diffusion media, leading to reduced kinetics. Because the dielectric constant, triple phase boundary surface area, and double-layer distance do not vary as a function of oxygen concentration, no change in the double-layer capacitance, Cdl, is expected. Additionally, the ionic transport properties of the membrane are not influenced by oxygen concentration, and therefore no change in Ohmic resistance, RΩ, is expected.
FIGURE 5. EIS spectra and fitted values from changes in cathode stoichiometry; (A) Nyquist plot of all measurements, (B) Nyquist plot of selected measurements at the cathode stoichiometry setpoints, (C) fitted resistance values and cathode stoichiometry as a function of time, and (D) fitted capacitance value and cathode stoichiometry as a function of time.
In contrast to the slower changes in water transport and equilibrium observed when the relative humidity of the fuel cell is changed, the change in oxygen flow rate occurs immediately upon changing the cathode stoichiometry set point. Figure 5A shows every multi-sine EIS Nyquist plot collected before and after the switch in cathode stoichiometry. All the spectra collected at their respective cathode stoichiometry values show an identical response, suggesting that no dynamic response can be captured with the multi-sine EIS protocol used here. A comparison of the Nyquist plots collected immediately before and after the change in cathode stoichiometry is shown in Figure 5B for simplicity. Although the rapid change in fuel cell parameters as a result of varying cathode stoichiometry cannot be captured dynamically by the multi-sine EIS technique, it is noteworthy that this method is able to capture the change in operating conditions in the very next Nyquist plot acquired. Even though this technique will do little to prevent rapid degradation from severe oxygen starvation that can occur on the order of a few seconds or less, it can be useful in providing diagnostic information for control strategies and relay algorithms to provide optimised operating conditions under mild starvation conditions, e.g., flooding or poisoning at the cathode catalyst layer.
Practical Application of the Technique to Fuel Cell Stacks
While not part of the experiments in this work, it is important to consider the applicability of the technique to stack-level systems. We have demonstrated that multi-sine EIS can capture the dynamic response of a single-cell fuel cell, and that it has potential as a method to continually monitor a cell and acquire diagnostic information during operation. Experimentally, it is not really more complicated to do the measurement at the stack level as the current at the stack level is the same as for the cell level. However, the larger potential and surface area of large stack systems, may then require the experimenter to develop specialized hardware for the system to be studied. In addition, the larger surface area leads to less detailed information as the response is averaged over a larger area. In the end, what is required is a ac current signal generator able to generate sufficiently large signal (5–10% of the steady-state current), and then, the EIS can be measured both at stack level and cell level by sampling the potential response at stack and cell level. Several examples of such systems have been shown in the literature, either through the DC-DC converter (Wang et al., 2019a; 2019b) or through a separate system of signal generation (Yuan et al., 2006a). While these examples don’t specifically use the multi-sine technique, there is no practical difference in hardware between the two types of implementation. In addition, the multi-sine technique has attracted commercial interest and commercialization of such systems for signal generation and cell level sampling is underway by among others a Canadian company (Pulsenics, 2022).
The practical application of the multi-sine EIS technique is feasible, but the multi-sine technique requires a larger total amplitude than the single-sine technique. This may be a problem practically, as such an signal has similarities with ripple current originating in the power converter, which has been shown to lead to some degradation (Wahdame et al., 2008; Gerard et al., 2010; Zhan et al., 2019). Further studies are therefore necessary to verify that both techniques do not contribute significantly to degradation when run in a continual manner.
Conclusion
We have shown that changes in fuel cell operating conditions, e.g., relative humidity and cathode stoichiometry, can be monitored using multi-sine EIS. Table 3 shows the four equivalent circuit parameters along with their approximate correlation to each of the operating conditions. The changes in operating conditions give rise to different EIS responses, making it possible to qualitatively identify the source of the change, in corroboration with previous literature results (de Beer, 2014). While the examples illustrated here, i.e., changes in RH and cathode stoichiometry, represent only a few examples of possible non-ideal operation (flooding, drying, starvation, poisoning etc.) or failure modes encountered during fuel cell operation, they demonstrate that the different physical phenomena occurring within the fuel cell have EIS responses that can be differentiated from one another and provide insight into potential corrective actions by the control system. The results here demonstrate that the multi-sine approach is a suitable technique to reduce the acquisition time of a full EIS spectrum, compared to the traditional single-sine approach, and can reliably provide information about several important fuel cell parameters, e.g., RΩ, Rct, Cdl, and Rmt. The EIS data acquisition can be used in conjunction with widely-available and open-source software, e.g., PyEIS or impedance.py, to obtain a full EIS spectrum from 50 kHz–0.5 Hz and high-quality fit of the data in as little as 50 s. Although this timeframe is suitable for observing the response of slower phenomena such as water balance, mild starvation, or catalyst poisoning, it is too long to rely on for observing phenomena that can lead to catastrophic failure in only a few seconds, such as severe starvation. Further optimisation of the multi-sine EIS technique to reduce acquisition time is therefore required to provide rapid analysis of the various processes occurring in the fuel cell.

TABLE 3. Summary of influence on parameters for the various changes investigated in this work.
Data Availability Statement
The raw data supporting the conclusion of this article will be made available by the authors, without undue reservation.
Author Contributions
TH and PF conceived and designed the analysis. PF performed the experiments and collected the data. The data analysis was done by TH, PF, and MG. The authors PF and TH prepared the manuscript. MG, ØU, and FZ reviewed and edited the manuscript.
Funding
The authors gratefully acknowledge support from MoZEES, a Norwegian Centre for Environment-friendly Energy Research (FME), co-sponsored by the Research Council of Norway (project number 257653) and 37 partners from research, industry, and public sector. The infrastructure used in the project is part of the Norwegian Fuel Cell and Hydrogen Centre (NFCH) fully funded by the Research Council of Norway (245678).
Conflict of Interest
The authors declare that the research was conducted in the absence of any commercial or financial relationships that could be construed as a potential conflict of interest.
The handling editor IP declared a past co-authorship and collaboration with the author(s) FZ.
Publisher’s Note
All claims expressed in this article are solely those of the authors and do not necessarily represent those of their affiliated organizations, or those of the publisher, the editors and the reviewers. Any product that may be evaluated in this article, or claim that may be made by its manufacturer, is not guaranteed or endorsed by the publisher.
Acknowledgments
The authors also thanks Christoffer Askvik Faugstad for making the software to automate EIS data fitting.
References
Asghari, S., Mokmeli, A., and Samavati, M. (2010). Study of PEM Fuel Cell Performance by Electrochemical Impedance Spectroscopy. Int. J. Hydrogen Energy 35 (17), 9283–9290. doi:10.1016/j.ijhydene.2010.03.069
Ballard Product Data Sheet: FCWave (2021). Ballard Product Data Sheet: FCWave. Burnaby, Canada: Ballard Power Systems Inc. Available at: https://www.ballard.com/docs/default-source/spec-sheets/fcwavetm-specification-sheet.pdf?sfvrsn=6e44dd80_6.
Baroody, H. A., and Kjeang, E. (2021). Predicting Platinum Dissolution and Performance Degradation under Drive Cycle Operation of Polymer Electrolyte Fuel Cells. J. Electrochem. Soc. 168 (4), 044524. doi:10.1149/1945-7111/abf5aa
Baumann, J., Boillot, L., Bruinsma, J., Cebolla, R. O., d'Amore-Domenech, R., Danebergs, J., et al. (2021). Hydrogen in the Maritime (IEA’s Hydrogen TCP Task 39, Issue. Paris, France: IEA.
Becherif, M., Péra, M.-C., Hissel, D., and Zheng, Z. (2018). Determination of the Health State of Fuel Cell Vehicle for a Clean Transportation. J. Clean. Prod. 171, 1510–1519. doi:10.1016/j.jclepro.2017.10.072
Brunetto, C., Moschetto, A., and Tina, G. (2009). PEM Fuel Cell Testing by Electrochemical Impedance Spectroscopy. Electr. Power Syst. Res. 79 (1), 17–26. doi:10.1016/j.epsr.2008.05.012
Cetinbas, F. C., Ahluwalia, R. K., Kariuki, N. N., De Andrade, V., and Myers, D. J. (2020). Effects of Porous Carbon Morphology, Agglomerate Structure and Relative Humidity on Local Oxygen Transport Resistance. J. Electrochem. Soc. 167 (1), 013508. doi:10.1149/2.0082001jes
Chevalier, S., Lee, J., Ge, N., Yip, R., Antonacci, P., Tabuchi, Y., et al. (2016). In Operando Measurements of Liquid Water Saturation Distributions and Effective Diffusivities of Polymer Electrolyte Membrane Fuel Cell Gas Diffusion Layers. Electrochimica Acta 210, 792–803. doi:10.1016/j.electacta.2016.05.180
Cruz-Manzo, S., and Chen, R. (2013). An Electrical Circuit for Performance Analysis of Polymer Electrolyte Fuel Cell Stacks Using Electrochemical Impedance Spectroscopy. J. Electrochem. Soc. 160 (10), F1109–F1115. doi:10.1149/2.025310jes
Cruz-Manzo, S., Chen, R., and Greenwood, P. (2015). An Impedance Model for Analysis of EIS of Polymer Electrolyte Fuel Cells under Hydrogen Peroxide Formation in the Cathode. J. Electroanal. Chem. 745, 28–36. doi:10.1016/j.jelechem.2015.03.012
Cruz-Manzo, S., Chen, R., and Rama, P. (2013). Study of Current Distribution and Oxygen Diffusion in the Fuel Cell Cathode Catalyst Layer through Electrochemical Impedance Spectroscopy. Int. J. Hydrogen Energy 38 (3), 1702–1713. doi:10.1016/j.ijhydene.2012.08.141
Cruz-Manzo, S., Perezmitre-Cruz, C., Greenwood, P., and Chen, R. (2016). An Impedance Model for Analysis of EIS of Polymer Electrolyte Fuel Cells under Platinum Oxidation and Hydrogen Peroxide Formation in the Cathode. J. Electroanal. Chem. 771, 94–105. doi:10.1016/j.jelechem.2016.02.046
de Beer, C. (2014). Condition Monitoring of Polymer Electrolyte Membrane Fuel Cells. PhD thesis (Rondebosch, CT, SA: Department of Electrical Engineering, University of Cape Town).
Debenjak, A., Gašperin, M., Pregelj, B., Atanasijević-Kunc, M., Petrovčič, J., and Jovan, V. (2013). Detection of Flooding and Drying inside a PEM Fuel Cell Stack. SV-JME 59 (01), 56–64. doi:10.5545/sv-jme.2012.640
Depernet, D., Narjiss, A., Gustin, F., Hissel, D., and Péra, M.-C. (2016). Integration of Electrochemical Impedance Spectroscopy Functionality in Proton Exchange Membrane Fuel Cell Power Converter. Int. J. Hydrogen Energy 41 (11), 5378–5388. doi:10.1016/j.ijhydene.2016.02.010
Deseure, J. (2008). Coupling RTD and EIS Modelling to Characterize Operating Non-uniformities on PEM Cathodes. J. Power Sources 178 (1), 323–333. doi:10.1016/j.jpowsour.2007.11.071
Dierickx, S., Weber, A., and Ivers-Tiffée, E. (2020). How the Distribution of Relaxation Times Enhances Complex Equivalent Circuit Models for Fuel Cells. Electrochimica Acta 355, 136764. doi:10.1016/j.electacta.2020.136764
EKPO PEMFC stack module NM12 Twin (2021). EKPO PEMFC Stack Module NM12 Twin. Dettingen an der Erms, Germany: EKPO Fuel Cell Technologies. Available at: https://www.elringklinger.de/sites/default/files/brochures/downloads/ekpo_factsheets_nm12_twin_fuel_cell_stack_modules_a4_en.pdf.
Engebretsen, E., Hinds, G., Meyer, Q., Mason, T., Brightman, E., Castanheira, L., et al. (2018). Localised Electrochemical Impedance Measurements of a Polymer Electrolyte Fuel Cell Using a Reference Electrode Array to Give Cathode-specific Measurements and Examine Membrane Hydration Dynamics. J. Power Sources 382, 38–44. doi:10.1016/j.jpowsour.2018.02.022
Fardoun, A. A., Hejase, H. A. N., Al-Marzouqi, A., and Nabag, M. (2017). Electric Circuit Modeling of Fuel Cell System Including Compressor Effect and Current Ripples. Int. J. Hydrogen Energy 42 (2), 1558–1564. doi:10.1016/j.ijhydene.2016.07.093
Fischer, A., Jindra, J., and Wendt, H. (1998). Porosity and Catalyst Utilization of Thin Layer Cathodes in Air Operated PEM-Fuel Cells. J. Appl. Electrochem. 28 (3), 277–282. doi:10.1023/a:1003259531775
Fletcher, T., Thring, R., and Watkinson, M. (2016). An Energy Management Strategy to Concurrently Optimise Fuel Consumption & PEM Fuel Cell Lifetime in a Hybrid Vehicle. Int. J. Hydrogen Energy 41 (46), 21503–21515. doi:10.1016/j.ijhydene.2016.08.157
Freire, T. J. P., and Gonzalez, E. R. (2001). Effect of Membrane Characteristics and Humidification Conditions on the Impedance Response of Polymer Electrolyte Fuel Cells. J. Electroanal. Chem. 503 (1), 57–68. doi:10.1016/S0022-0728(01)00364-3
Gerard, M., Poirot-Crouvezier, J.-P., Hissel, D., and Péra, M.-C. (2010). Ripple Current Effects on PEMFC Aging Test by Experimental and Modeling. J. Fuel Cell. Sci. Technol. 8 (2). doi:10.1115/1.4002467
Getting started with impedance.py (2021). Getting Started with impedance.Py. Impedance.py Developers. Available at: https://impedancepy.readthedocs.io/en/latest/getting-started.html.
Giner-Sanz, J. J., Ortega, E. M., and Pérez-Herranz, V. (2018). Mechanistic Equivalent Circuit Modelling of a Commercial Polymer Electrolyte Membrane Fuel Cell. J. Power Sources 379, 328–337. doi:10.1016/j.jpowsour.2018.01.066
Halvorsen, I. J., Pivac, I., Bezmalinović, D., Barbir, F., and Zenith, F. (2020). Electrochemical Low-Frequency Impedance Spectroscopy Algorithm for Diagnostics of PEM Fuel Cell Degradation. Int. J. Hydrogen Energy 45 (2), 1325–1334. doi:10.1016/j.ijhydene.2019.04.004
Kang, J., and Kim, J. (2010). Membrane Electrode Assembly Degradation by Dry/wet Gas on a PEM Fuel Cell. Int. J. Hydrogen Energy 35 (23), 13125–13130. doi:10.1016/j.ijhydene.2010.04.077
Lochner, T., Perchthaler, M., Binder, J. T., Sabawa, J. P., Dao, T. A., and Bandarenka, A. S. (2020). Real‐Time Impedance Analysis for the On‐Road Monitoring of Automotive Fuel Cells. ChemElectroChem 7 (13), 2784–2791. doi:10.1002/celc.202000510
Mérida, W., Harrington, D. A., Le Canut, J. M., and McLean, G. (2006). Characterisation of Proton Exchange Membrane Fuel Cell (PEMFC) Failures via Electrochemical Impedance Spectroscopy. J. Power Sources 161 (1), 264–274. doi:10.1016/j.jpowsour.2006.03.067
Migliardi, F., and Corbo, P. (2013). CV and EIS Study of Hydrogen Fuel Cell Durability in Automotive Applications. Int. J. Electrochem. Sci. 8, 11033–11047.
Morin, A., Peng, Z., Jestin, J., Detrez, M., and Gebel, G. (2013). Water Management in Proton Exchange Membrane Fuel Cell at Sub-zero Temperatures: An in Operando SANS-EIS Coupled Study. Solid State Ionics 252, 56–61. doi:10.1016/j.ssi.2013.07.010
MoZEES (2020). Annual Report 2020. Amsterdam, Netherlands: MoZEES. Available at: https://mozees.no/wp-content/uploads/2021/11/21-0128-Arsrapport-MoZEES-2020_web.pdf.
Najafi, B., Bonomi, P., Casalegno, A., Rinaldi, F., and Baricci, A. (2020). Rapid Fault Diagnosis of PEM Fuel Cells through Optimal Electrochemical Impedance Spectroscopy Tests. Energies 13 (14), 3643. doi:10.3390/en13143643
Nedstack PemGen MT-FCPI-500 (2021). Nedstack PemGen MT-FCPI-500. Arnhem, Netherlands: Nedstack PEM FUEL CELLS. Available at: https://nedstack.com/sites/default/files/2021-02/mt-fcpi-500-datasheet.pdf.
Novitski, D., and Holdcroft, S. (2015). Determination of O2 Mass Transport at the Pt | PFSA Ionomer Interface under Reduced Relative Humidity. ACS Appl. Mat. Interfaces 7 (49), 27314–27323. doi:10.1021/acsami.5b08720
Onanena, R., Oukhellou, L., Candusso, D., Harel, F., Hissel, D., and Aknin, P. (2011). Fuel Cells Static and Dynamic Characterizations as Tools for the Estimation of Their Ageing Time. Int. J. Hydrogen Energy 36 (2), 1730–1739. doi:10.1016/j.ijhydene.2010.10.064
Paganin, V. A., Oliveira, C. L. F., Ticianelli, E. A., Springer, T. E., and Gonzalez, E. R. (1998). Modelisticinterpretation of the Impedance Response of a Polymer Electrolyte Fuel Cell. Electrochimica Acta 43 (24), 3761–3766. doi:10.1016/s0013-4686(98)00135-2
Pan, R., Yang, D., Wang, Y., and Chen, Z. (2020). Health Degradation Assessment of Proton Exchange Membrane Fuel Cell Based on an Analytical Equivalent Circuit Model. Energy 207, 118185. doi:10.1016/j.energy.2020.118185
Peckham, T. J., Schmeisser, J., and Holdcroft, S. (2008). Relationships of Acid and Water Content to Proton Transport in Statistically Sulfonated Proton Exchange Membranes: Variation of Water Content via Control of Relative Humidity. J. Phys. Chem. B 112 (10), 2848–2858. doi:10.1021/jp077218t
Pivac, I., Bezmalinović, D., and Barbir, F. (2018). Catalyst Degradation Diagnostics of Proton Exchange Membrane Fuel Cells Using Electrochemical Impedance Spectroscopy. Int. J. Hydrogen Energy 43 (29), 13512–13520. doi:10.1016/j.ijhydene.2018.05.095
Popkirov, G. S., and Schindler, R. N. (1993). Optimization of the Perturbation Signal for Electrochemical Impedance Spectroscopy in the Time Domain. Rev. Sci. Instrum. 64 (11), 3111–3115. doi:10.1063/1.1144316
PowerCell PowerCellution Marine System 200 (2021). PowerCell PowerCellution Marine System 200. Gothenburg, Sweden: PowerCell Sweden AB. Available at: https://www.datocms-assets.com/36080/1637225345-marine-system-200-v-221.pdf.
Pulsenics (2022). Real-time Electrochemical System Monitoring & Control. Available at: https://www.pulsenics.com/(Accessed April2022 22.
Reid, O. R., Saleh, F. S., and Easton, E. B. (2013). Determining Electrochemically Active Surface Area in PEM Fuel Cell Electrodes with Electrochemical Impedance Spectroscopy and its Application to Catalyst Durability. Electrochimica Acta 114, 278–284. doi:10.1016/j.electacta.2013.10.050
Reiser, C. A., Bregoli, L., Patterson, T. W., Yi, J. S., Yang, J. D., Perry, M. L., et al. (2005). A Reverse-Current Decay Mechanism for Fuel Cells. Electrochem. Solid-State Lett. 8 (6), A273. doi:10.1149/1.1896466
Reshetenko, T. V., Bethune, K., Rubio, M. A., and Rocheleau, R. (2014). Study of Low Concentration CO Poisoning of Pt Anode in a Proton Exchange Membrane Fuel Cell Using Spatial Electrochemical Impedance Spectroscopy. J. Power Sources 269, 344–362. doi:10.1016/j.jpowsour.2014.06.146
Rezaei Niya, S. M., and Hoorfar, M. (2013). Study of Proton Exchange Membrane Fuel Cells Using Electrochemical Impedance Spectroscopy Technique - A Review. J. Power Sources 240, 281–293. doi:10.1016/j.jpowsour.2013.04.011
Rodat, S., Sailler, S., Druart, F., Thivel, P.-X., Bultel, Y., and Ozil, P. (2009). EIS Measurements in the Diagnosis of the Environment within a PEMFC Stack. J. Appl. Electrochem 40 (5), 911–920. doi:10.1007/s10800-009-9969-0
Romero-Castañón, T., Arriaga, L. G., and Cano-Castillo, U. (2003). Impedance Spectroscopy as a Tool in the Evaluation of MEA’s. J. Power Sources 118 (1-2), 179–182. doi:10.1016/s0378-7753(03)00085-5
Shan, J., Lin, R., Chen, X., and Diao, X. (2018). EIS and Local Resolved Current Density Distribution Analysis on Effects of MPL on PEMFC Performance at Varied Humidification. Int. J. Heat Mass Transf. 127, 1076–1083. doi:10.1016/j.ijheatmasstransfer.2018.08.033
Simon Araya, S., Zhou, F., Lennart Sahlin, S., Thomas, S., Jeppesen, C., and Knudsen Kær, S. (2019). Fault Characterization of a Proton Exchange Membrane Fuel Cell Stack. Energies 12 (1), 152. doi:10.3390/en12010152
Springer, T. E., Zawodzinski, T. A., Wilson, M. S., and Gottesfeld, S. (1996). Characterization of Polymer Electrolyte Fuel Cells Using AC Impedance Spectroscopy. J. Electrochem. Soc. 143 (2), 587–599. doi:10.1149/1.1836485
Tang, W., Lin, R., Weng, Y., Zhang, J., and Ma, J. (2013). The Effects of Operating Temperature on Current Density Distribution and Impedance Spectroscopy by Segmented Fuel Cell. Int. J. Hydrogen Energy 38 (25), 10985–10991. doi:10.1016/j.ijhydene.2013.01.099
Wagner, N., and Gülzow, E. (2004). Change of Electrochemical Impedance Spectra (EIS) with Time during CO-poisoning of the Pt-Anode in a Membrane Fuel Cell. J. Power Sources 127 (1-2), 341–347. doi:10.1016/j.jpowsour.2003.09.031
Wahdame, B., Girardot, L., Hissel, D., Harel, F., Francois, X., Candusso, D., et al. (2008). “Impact of Power Converter Current Ripple on the Durability of a Fuel Cell Stack.” in 2008 IEEE International Symposium on Industrial Electronics.
Wang, H., Gaillard, A., and Hissel, D. (2019b). A Review of DC/DC Converter-Based Electrochemical Impedance Spectroscopy for Fuel Cell Electric Vehicles. Renew. Energy 141, 124–138. doi:10.1016/j.renene.2019.03.130
Wang, H., Gaillard, A., and Hissel, D. (2019a). Online Electrochemical Impedance Spectroscopy Detection Integrated with Step-Up Converter for Fuel Cell Electric Vehicle. Int. J. Hydrogen Energy 44 (2), 1110–1121. doi:10.1016/j.ijhydene.2018.10.242
Wu, J., Yuan, X., Wang, H., Blanco, M., Martin, J., and Zhang, J. (2008). Diagnostic Tools in PEM Fuel Cell Research: Part I Electrochemical Techniques. Int. J. Hydrogen Energy 33 (6), 1735–1746. doi:10.1016/j.ijhydene.2008.01.013
Yuan, X., Sun, J. C., Blanco, M., Wang, H., Zhang, J., and Wilkinson, D. P. (2006a). AC Impedance Diagnosis of a 500W PEM Fuel Cell Stack. J. Power Sources 161 (2), 920–928. doi:10.1016/j.jpowsour.2006.05.003
Yuan, X., Sun, J. C., Wang, H., and Zhang, J. (2006b). AC Impedance Diagnosis of a 500W PEM Fuel Cell Stack. J. Power Sources 161 (2), 929–937. doi:10.1016/j.jpowsour.2006.07.020
Yuan, X., Wang, H., Colinsun, J., and Zhang, J. (2007). AC Impedance Technique in PEM Fuel Cell Diagnosis-A Review. Int. J. Hydrogen Energy 32 (17), 4365–4380. doi:10.1016/j.ijhydene.2007.05.036
Keywords: PEMFC, hydrogen, fuel cells, electrochemical impedance spectroscopy (EIS), diagnostics
Citation: Fortin P, Gerhardt MR, Ulleberg Ø, Zenith F and Holm T (2022) Multi-Sine EIS for Early Detection of PEMFC Failure Modes. Front. Energy Res. 10:855985. doi: 10.3389/fenrg.2022.855985
Received: 16 January 2022; Accepted: 09 May 2022;
Published: 26 May 2022.
Edited by:
Ivan Pivac, University of Split, FESB, CroatiaReviewed by:
Stephane Rael, Université de Lorraine, FranceAntonio Martínez Chaparro, Centro de Investigaciones Energéticas, Medioambientales y Tecnológicas, Spain
Copyright © 2022 Fortin, Gerhardt, Ulleberg, Zenith and Holm. This is an open-access article distributed under the terms of the Creative Commons Attribution License (CC BY). The use, distribution or reproduction in other forums is permitted, provided the original author(s) and the copyright owner(s) are credited and that the original publication in this journal is cited, in accordance with accepted academic practice. No use, distribution or reproduction is permitted which does not comply with these terms.
*Correspondence: Thomas Holm, thomas.holm@ife.no