Arctic sea ice coverage from 43 years of satellite passive-microwave observations
 Claire L. Parkinson
- Cryospheric Sciences Laboratory, Goddard Space Flight Center, National Aeronautics and Space Administration (NASA), Greenbelt, MD, United States
Satellite passive-microwave instrumentation has allowed the monitoring of Arctic sea ice over the past 43 years, and this monitoring has revealed and quantified major changes occurring in Arctic sea ice coverage. The 43-year 1979–2021 record shows considerable interannual variability but also a long-term downward trend in Arctic sea ice that is clear from many vantage points: A linear-least-square trend of −54,300 ± 2,700 km2/year for yearly average sea ice extents; statistically significant negative trends for each of the 12 calendar months; negative trends for each of nine regions into which the Arctic sea ice cover is divided; the fact that for all 12 calendar months the highest monthly average sea ice extent came in the first 8 years of the record and the lowest monthly average sea ice extent came in the last 10 years of the record; and a prominent shortening of the sea ice season throughout much of the marginal ice zone, with the length of the sea ice season in some locations decreasing by over 100 days and some locations previously experiencing months-long sea ice seasons now typically no longer having a sea ice season at all. The overall, Arctic-wide trend value of the yearly average sea ice extents since 1979 has consistently had a negative magnitude exceeding two standard deviations of the trend line slope since 1990 and has remained in the narrow range of −53,000 km2/yr to −55,500 km2/yr since 2011.
1 Introduction
Prior to the 1970s, sea ice was one of the lesser-known climate variables. With sea ice extending over vast areas and no permanent settlements on the sea ice, the records were generally limited to those obtained from explorers and from ships traversing the area for economic reasons, often whaling and sealing, plus some records from coastal communities and from the few scientific expeditions that had ventured into the Arctic sea ice territory. The most prominent coastal-community record is a centuries-long record from Iceland (Koch, 1945).
The situation today regarding records of the Arctic sea ice cover is remarkably different from what it had been prior to the 1970s, and in substantial part this is due to the records obtained from satellite data. Satellites go a long way toward “leveling the playing field” when it comes to data collection. With satellites there is no advantage or disadvantage to being close to a human settlement. Passive-microwave instrumentation in particular has allowed a satellite record of Arctic sea ice coverage that extends back to the late 1970s.
This paper presents an array of results from a 43-year record of Arctic sea ice derived from a sequence of satellite passive-microwave instruments. These results quantify the decreasing Arctic sea ice coverage over the last 43 years, robustly illustrating the changes in one key component of the Earth’s climate system. Sea ice coverage matters to the Earth system in many ways: It reflects solar radiation back to space, thereby keeping the polar regions colder than they otherwise would be; it is an insulator between the liquid ocean and the atmosphere, restricting exchanges of heat, mass, and momentum; it is a buffer helping to protect coasts from wind-driven waves; it transports cold, relatively fresh water equatorward; and it serves as a platform for such polar animals as polar bears and Arctic foxes, while hindering the movement of such marine animals as whales (e.g., Barry et al., 1993; Walsh, 2013; Meier et al., 2014; Vihma, 2014). Without sea ice, the Arctic climate and ecosystem would be quite different from what they are today.
2 Data and methods
The data used in this paper come from satellite passive-microwave instruments, specifically the Scanning Multichannel Microwave Radiometer (SMMR) on NASA’s Nimbus 7 satellite, the Special Sensor Microwave Imager (SSMI) on the F8, F11, and F13 satellites of the United States (U.S.) Department of Defense’s Defense Meteorological Satellite Program (DMSP), and the SSMI Sounder (SSMIS) on the DMSP F17 satellite. The Nimbus 7 satellite was launched on 24 October 1978; the F8 satellite, carrying the first SSMI instrument, was launched on 18 June 1987; and the F17 satellite was launched on 4 November 2006. For this study, SMMR data are used for January 1979–mid-August 1987, SSMI data for mid-August 1987–December 2007, and SSMIS data for January 2008–December 2021. The SMMR, SSMI, and SSMIS are not identical instruments orbiting in identical orbits: They fly at different altitudes, they take measurements at different combinations of frequencies, and they have different fields of view even for channels with the same frequencies. Still, they are similar enough that an extensive effort at intercalibration between successive instruments has yielded a consistent long-term record. Details of the instrument differences and the intercalibration process are provided in Cavalieri et al. (1999) for the SMMR/SSMI transition and in Cavalieri et al. (2012) for the SSMI/SSMIS transition. Advances in satellite instrumentation have been quite noticeable in the reduction of missing and flawed data when moving from the SMMR to the SSMI and from the SSMI to the SSMIS.
One of the primary reasons that the SMMR, SSMI, and SSMIS can each provide robust records of sea ice coverage is that they each measure at one or more frequencies where there is a sharp contrast between the microwave emissions of ice versus liquid water. For instance, for the SMMR 18 GHz horizontally polarized data, the brightness temperature of liquid water tends to be ∼98.5 K, whereas the brightness temperature of first-year ice is ∼225.2 K and the brightness temperature of older, multiyear ice is ∼186.8 K (Cavalieri et al., 1999). The corresponding values for the SSMIS 19 GHz horizontally polarized data are 113.4 K for liquid water, 232.0 K for first-year ice, 196.0 K for multiyear ice (Cavalieri et al., 2012). With such large distinctions between ice and water, the ice edge tends to be readily distinguished on maps of the 18 and 19 GHz data. Furthermore, there are sharply different contrasts at other frequencies, with, for instance, liquid water having a brightness temperature (∼199.4 K) between the brightness temperatures of first-year ice (∼239.8 K) and multiyear ice (∼180.8 K) for the SMMR 37 GHz vertically polarized data (Cavalieri et al., 1999). By incorporating these different contrasts, algorithms are able to distinguish first-year ice from multiyear ice as well as ice from liquid water.
Two other crucial factors enhancing the value of passive-microwave sensors for sea ice studies are: 1) microwave radiation (at selected microwave wavelengths) can pass through clouds, thereby enabling sea ice observations in the presence of clouds as well as under cloud-free conditions; and 2) the microwave radiation is emitted from within the Earth system rather than being reflected sunlight, thereby enabling sea ice observations in the dark winter months as well as during sunlit periods. These two factors provide major advantages for the use of microwave radiation rather than visible radiation in generating and analyzing climate-relevant sea ice data sets.
The passive-microwave data are gridded onto a polar stereographic projection with grid cell (or pixel) areas of approximately 625 km2 (25 km × 25 km) at 70° latitude, ranging up to approximately 665 km2 at the North Pole. The gridded radiative data are received at NASA Goddard Space Flight Center from the U.S. National Snow and Ice Data Center (NSIDC) and are then used to calculate sea ice concentrations, which are sent to NSIDC for archival and distribution. Sea ice concentrations are the percent areal coverages of sea ice in each grid cell. The algorithm used to calculate the sea ice concentrations is the NASA Team Algorithm described in Gloersen et al. (1992). This algorithm has been widely used in analyses of sea ice coverage from satellite passive-microwave data, for both the Arctic and the Antarctic (e.g., Parkinson et al., 1999; Zwally et al., 2002).
The sea ice concentrations provide the basis for the calculation of sea ice extents, with sea ice extent, at any given time, being the sum of the areas of each grid cell in the region of interest having a calculated or assumed sea ice concentration of at least 15%. [Calculations are done for each ocean pixel covered by the satellite data. The only assumed sea ice concentrations are for pixels in the immediate vicinity of the North Pole, where there are no SMMR, SSMI, or SSMIS data due to the satellites not passing directly over the Pole. The satellite orbits and instrument scanning characteristics differ, with the result that the SMMR data extend poleward to 84.6°N, the SSMI data extend poleward to 87.6°N, and the SSMIS data extend poleward to 89.2°N. Fortunately, in each case the data surrounding the missing-data region suggest that it is extremely likely that each pixel within the Pole-centered missing-data region has an ice concentration of at least 15%, and consequently that is the assumption made in the calculation of ice extents.] Sea ice extents are calculated on a daily basis (every-other-day for the SMMR data) and are combined to monthly and yearly averages. Linear-least-square trends are calculated both for the yearly averages and for a variable called “monthly deviations,” which eliminates the prominent annual cycle in the monthly average data by subtracting from each individual month (e.g., January 1979) the average of that calendar month’s values through the entire record (e.g., the average January for 1979–2021). Standard deviations of the slopes of the linear-least-square trend lines are calculated following Draper and Smith (1981) and Taylor (1997).
The satellite passive-microwave datasets used in this study are archived at NSIDC in Boulder, Colorado, and are available on the NSIDC website, https://nsidc.org (Cavalieri et al., 1996, updated yearly).
3 Results
3.1 Sea ice concentrations and geographic expanse
Every year, Arctic sea ice coverage undergoes a substantial expansion in autumn and winter and a substantial decay in spring and summer, with sea ice in March extending over almost the entire Arctic Ocean and many of the surrounding seas and bays (Figures 1A–C) and sea ice coverage by the end of summer reducing to an area largely within the Arctic Ocean (Figures 1D–F). Ice concentrations tend to be greater than 90% for most of the region in late winter but much lower at the end of summer (Figure 1). The winter ice distributions reflect the importance of the Gulf Stream in bringing warm waters northeast across the North Atlantic, resulting in ice-free waters at quite high latitudes (70–75°N) immediately north of Norway (Figures 1A–C). In contrast, Hudson Bay remains covered with ice in late winter, despite its much lower latitudes (52–65°N), as a result of the continentality effect, wherein mid-continent locations tend to have colder winters and hotter summers than coastal locations affected by the moderating effect of the oceans (Figures 1A–C).
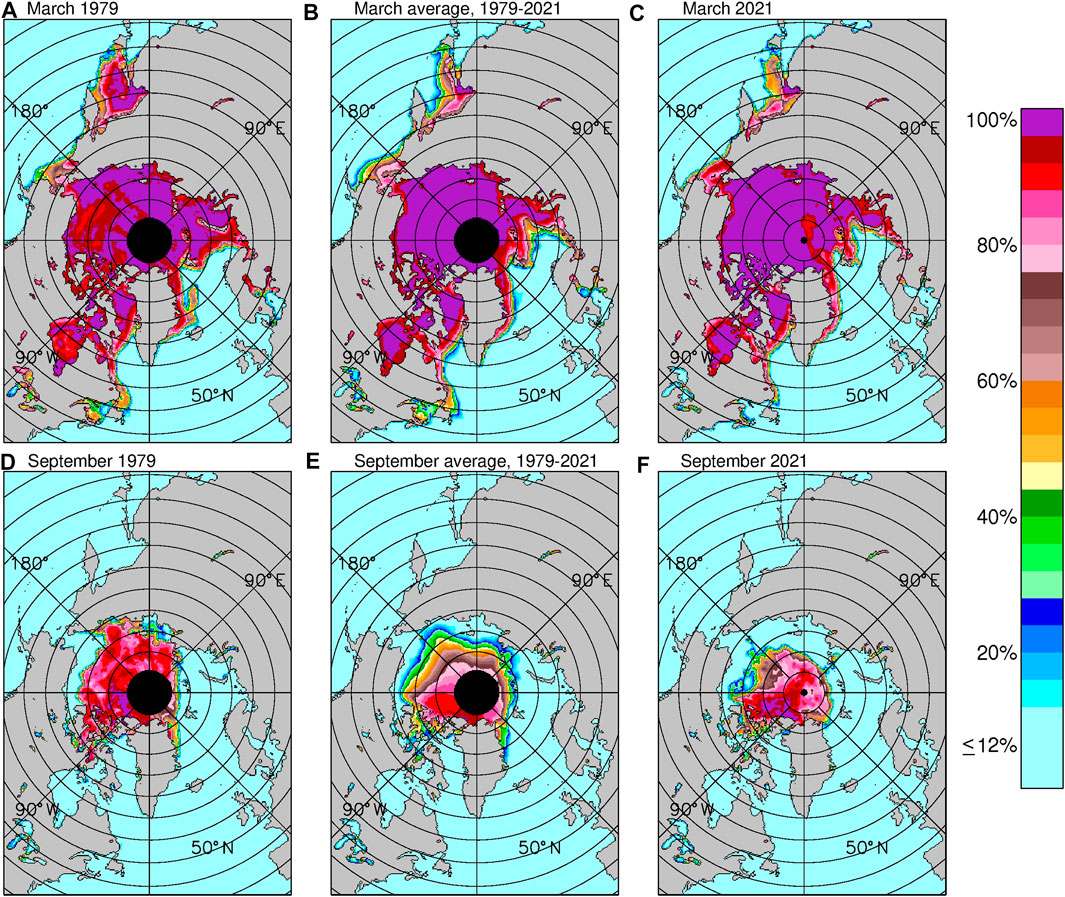
FIGURE 1. Average Arctic sea ice concentrations for: (A) March 1979, (B) the 43-year March average, 1979–2021, (C) March 2021, (D) September 1979, (E) the 43-year September average, 1979–2021, (F) September 2021. The prominent black circular region centered on the North Pole in the 1979 and 1979–2021 images represents missing data and reflects the fact that the orbit of the Nimbus 7 satellite, obtaining the data for the first 8.6 years of the 43-year record, did not bring the satellite close enough to the Pole to allow data collection poleward of 84.6°N.
The lesser sea ice coverage in 2021 versus 1979 is apparent in both the March and September maps (Figure 1). For instance, in March the ice-free waters to the north of Norway extended noticeably further north in 2021 than in 1979, and much of the eastern half of the Sea of Okhotsk (the sea centered at about 54°N, 150°E) was ice-free in March 2021 but ice-covered in March 1979 (Figures 1A,C). Comparison of the 1979 and 2021 September images reveals notably less sea ice coverage in 2021 than in 1979 to the east of northern Greenland and in the Canadian Archipelago region and, even more strikingly, to the north of Russia. In September 2021, a ship could have traversed a northeast passage from the Atlantic to the Pacific in the waters north of Russia with little if any complications from sea ice, whereas that would not have been the case in September 1979 (Figures 1D,F).
3.2 Sea ice extents and trends
3.2.1 Arctic-wide sea ice extents and trends
Figure 2 presents the monthly average sea ice extents, monthly deviations, and yearly averages for the entire 43-year record. In every one of the years 1979–2021, the month with the lowest monthly average northern hemisphere sea ice extent was September, with the September average values ranging from 3.60 × 10⁶ km2 in 2012 to 7.75 × 10⁶ km2 in 1980 and averaging 6.05 × 10⁶ km2 overall (Figure 2A). The month with the highest monthly average sea ice extent was March for every year except 1987, 1989, 1998, and 2015, in which instances it was February by a narrow margin (Figure 2A). These monthly-high values ranged from 14.10 × 10⁶ km2 in March 2018 to 16.05 × 10⁶ km2 in March 1979, with the overall average March ice extent being 15.07 × 10⁶ km2 (Figure 2A).
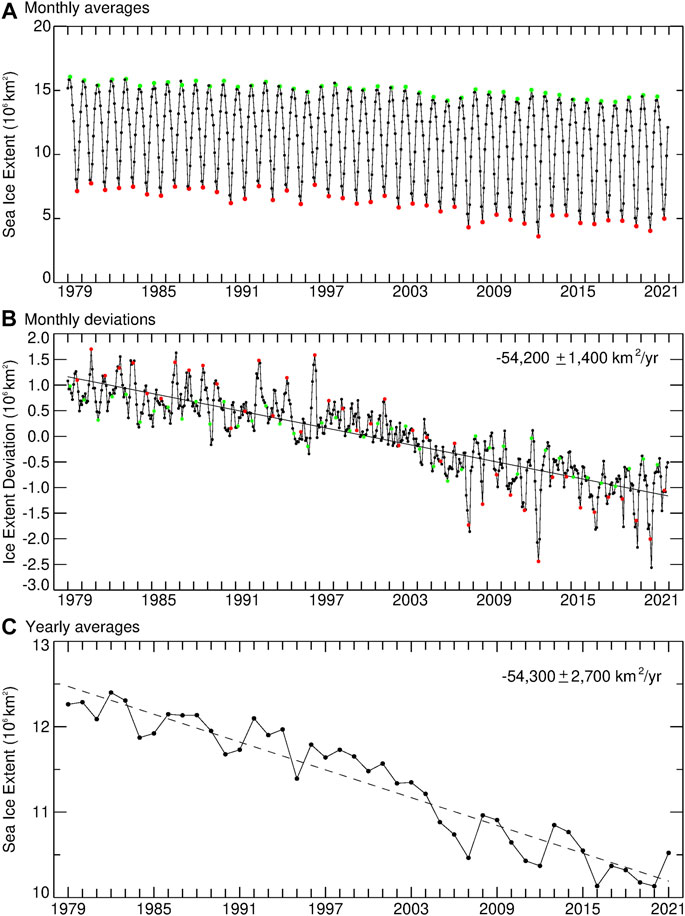
FIGURE 2. (A) Monthly average Arctic sea ice extents, January 1979–December 2021. March ice extents are depicted in green, September ice extents in red, and all others smaller and in black. (B) Monthly Arctic sea ice extent deviations, January 1979–December 2021, with March values in green, September values in red, and all others smaller and in black. (C) Yearly average Arctic sea ice extents, 1979–2021. The (B) and (C) plots both include the linear-least-square trend line through the data and the trend line slope and standard deviation. The x-axis tick marks for plots (A) and (B) come at the January values for each year.
The prominent annual cycle of Arctic sea ice extents, with far more sea ice coverage in winter than in summer, dominates plots of monthly averages (Figure 2A). In fact, in the early years of the record, it was not immediately obvious from the monthly average plots that there was a downward trend, although by the late 1990s this had become obvious through the removal of the annual cycle in the monthly deviation and yearly average calculations (Parkinson et al., 1999). By now, the downward trend is apparent even from the monthly average plots (Figure 2A), although it is still more strongly highlighted through the monthly deviations (Figure 2B) and yearly averages (Figure 2C), where the downward trend is quite prominent, with linear-least-square trend lines having slopes of −54,200 ± 1,400 km2/yr for the monthly deviations and −54,300 ± 2,700 km2/yr for the yearly averages. This equates, on average, to an areal loss of sea ice extent each year exceeding the area of Costa Rica (area of 51,100 km2).
There had been vague hints of a downward trend in Arctic sea ice extents as early as the late 1980s (e.g., Parkinson and Cavalieri, 1989) and more solid indications by the late 1990s (e.g., Johannessen et al., 1995; Maslanik et al., 1996; Parkinson et al., 1999). Quantitatively, it is with the 1990 data that the negative trend in yearly average Arctic sea ice extents since 1979 first reaches a value low enough that two standard deviations above it is also negative (Figure 3). This has continued to be the case ever since, with a narrowing of the standard deviation bars as more years are added (Figure 3). The calculated trend value has been in the narrow range of −53,000 km2/yr to −55,500 km2/yr since 2011 (Figure 3).
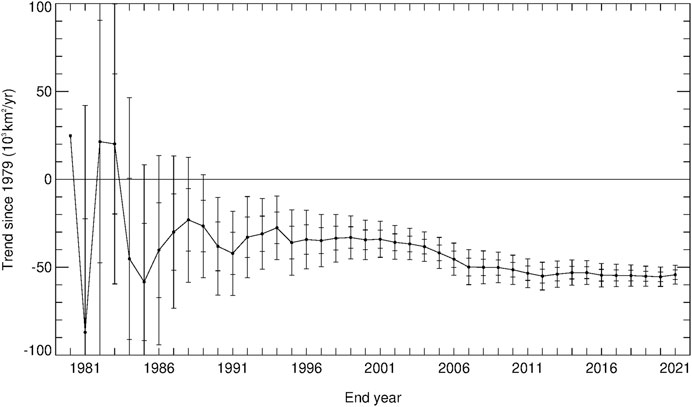
FIGURE 3. Linear-least-square slopes of the trend line in Arctic yearly average sea ice extents, from the 1979–1980 slope with only 2 years of data to the 1979–2021 slope with 43 years of data. The bars centered on each trend value after the first have ticks marking one and two standard deviations from the trend.
Despite the downward trend being apparent for many years before 2007, the major plummeting of the ice cover in summer 2007 (Figure 2B) came as a shock to the sea ice research community. Not only did the 2007 decrease in ice extent establish a new record low for Arctic sea ice extent in the satellite era, at 4.1 × 10⁶ km2, on 14 September 2007, but it was 24% below the previous record low, 5.4 million km2, reached 2 years earlier on 21 September 2005. The 2007 decrease was so stunning that speculations arose regarding the possibility of a sea-ice-free late-summer Arctic occurring within the next decade. This did not happen, as instead the ice extents rebounded somewhat in the subsequent few years, before falling to a new record low in 2012 (as reflected in Figures 2A,B).
Both the 2007 and 2012 cases generated studies examining why the ice retreat in those 2 years was anomalously large, with results in both cases attributing the unusually low ice extents to a combination of preconditioning of the ice cover [with thinner ice and more open water than was common at the start of the satellite record (e.g., Maksym, 2019)] and the specific weather conditions in those two summer seasons. In the 2007 case, weather conditions included higher than normal temperatures and winds blowing into the Beaufort and Chukchi seas from the south, pushing the ice to the north (e.g., Comiso et al., 2008), and the fact that conditions were unusually cloud-free over the Arctic Ocean, favoring increased melt through increased incident solar radiation (Kay et al., 2008). In the 2012 case, a major storm in the central Arctic in early August contributed to the ice decreases (Simmonds and Rudeva, 2012; Parkinson and Comiso, 2013), as likely did also the unusual amount of relatively warm water discharged into the sea ice region north of Alaska and northwestern Canada by the Mackenzie River by early July (Nghiem et al., 2014). Through use of a computer model, Zhang et al. (2013) were able to simulate the August 2012 storm and examine different variables and processes, concluding that the decrease in ice volume during the storm was in large part due to increased bottom melt caused by the increased upward ocean heat flux from the wind-induced enhanced ocean mixing.
Because September is almost always the month when Arctic sea ice coverage reaches its annual minimum ice extent, and because September has also experienced a strong downward trend in sea ice coverage, it tends to be the month when media attention to Arctic sea ice is greatest. However, all 12 calendar months have experienced decreasing ice coverage since 1979, and the 1979–2021 negative trend for October is comparable to (numerically even very slightly greater in magnitude than) that for September (Figure 4). In both the 2007 and 2012 cases of record low sea ice coverages, July was the month when the unusually low ice conditions became apparent, continuing in August, and lasting beyond September into October (Figure 4). For all 12 months, the sea ice extent trends since 1979 have been consistently below 0 by at least two standard deviations at least since 1998. The 2 months consistently clearing the two-standard-deviation threshold for the longest period are April and May, both of which first cleared the threshold with the 1979–1989 trend and have continued to do so ever since.
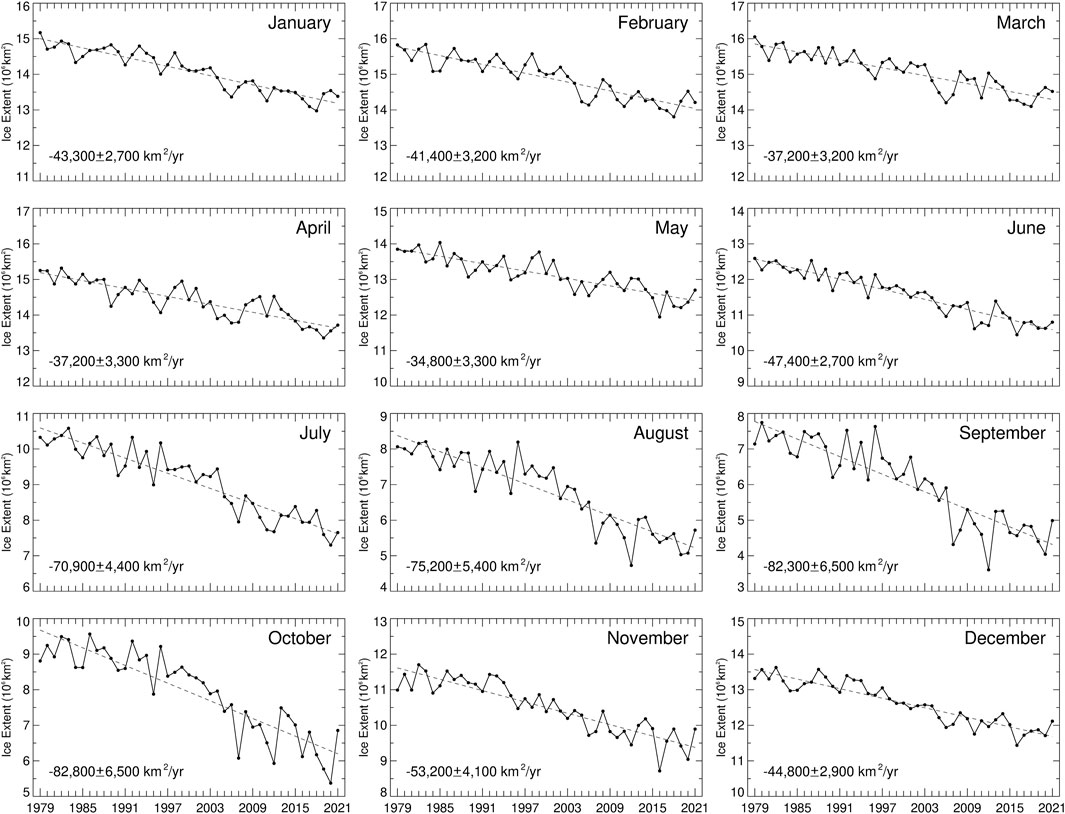
FIGURE 4. Arctic sea ice extents and trends, 1979–2021, for each of the 12 calendar months. The y-axis values vary for the different months, but in each case there is a range of 5 × 10⁶ km2, to allow ready visual comparison of the trend-line slopes.
The 43-year time series of ice extents for the individual months (Figure 4) and for the yearly averages (Figure 2C) all illustrate the variability of the Arctic sea ice cover as well as the downward trend in sea ice coverage. For every calendar month and the yearly averages, there is at least one period of 6 years or longer when the trend in ice extents was positive rather than negative (Figure 2C, Figure 4). For instance, the rebounding from the still-record-low in 2012 results in positive August and September trends for the final 10 years of the record (2012–2021), despite August and September having quite substantial downward trends overall (Figure 4). Interannual variability is a common feature of climate records, and Figure 2C and Figure 4 are illustrative of that for the Arctic sea ice cover.
3.2.2 Sea ice extent record highs and lows
Another way to assess the changes in Arctic sea ice extents, complementary to the trend results, is to examine the occurrences and frequency of new record high and record low ice extent values. This was first done in a 2016 paper covering the SMMR/SSMI/SSMIS record for 1979–2015 (Parkinson and DiGirolamo, 2016) and was later updated through 2020 (Parkinson and DiGirolamo, 2021). These studies specify for each calendar month every time a new record high was reached for that month and every time a new record low was reached for that month. The results are striking, and since no new records were reached in 2021, the Parkinson and DiGirolamo (2021) results remain valid for the full 1979–2021 period. Specifically: 1) There has not been a single new record high monthly average Arctic sea ice extent for any of the 12 calendar months since 1986, when a record high was registered for October; 2) 93 new record low monthly average Arctic sea ice extents have occurred since 1986; 3) every one of the 12 calendar months has experienced at least one new record low since 2011; 4) on a yearly average basis, the last record high was in 1982, with 12 new record low yearly average sea ice extents since that time, the latest (and hence current record low for yearly averages) coming in 2020 (Parkinson and DiGirolamo, 2021). These results add compelling confirmation of the declining Arctic sea ice coverage.
Figure 5 presents the 43-year average annual cycle of monthly average Arctic sea ice extents along with the highest and lowest monthly average values reached for each month and the years in which those values occurred. For 3 months the record high came in 1979, the first year of the 43-year record, and for all 12 months the record high came in the first 8 years of the record, whereas all 12 record lows came in the last 10 years of the record (Figure 5). Still, for most months (December through June), the percent difference between the highest and lowest monthly average value over the 43 years is less than 18% (Figure 5).
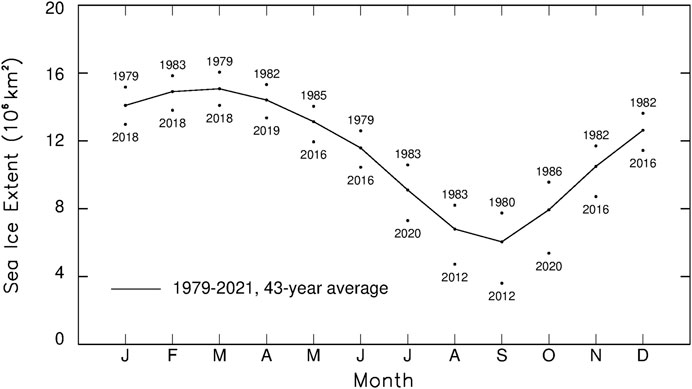
FIGURE 5. Average annual cycle of monthly-average Arctic sea ice extents over the 43-year period 1979–2021, along with the 43-year highest and lowest monthly-average values for each month and the years in which those highs and lows occurred.
3.2.3 Regional results
Examination of different regions within the Arctic sea ice cover reveals much greater variability in the regional results than in the results for the Arctic sea ice cover as a whole. Still, using nine regions identified in earlier studies (e.g., Parkinson et al., 1999), every one of the regions has a negative trend over the course of the 43-year 1979–2021 record (Figure 6). This is decidedly not the case for shorter time periods. For instance, the Gulf of St. Lawrence and Baffin Bay/Labrador Sea had visually prominent upward (positive) trends through 1994 and 1993, respectively, and the Bering Sea had a clearly positive trend even as late as 2013, for the 1979–2013 period (Figure 6). In fact, the trend values of the annual average Bering Sea ice extents since 1979 were consistently positive (although not statistically significant) from the start of the trend record, at 1979–1980, to the 1979–2002 period, then slightly negative from the 1979–2003 period to the 1979–2008 period, then positive again for 1979–2009 through 1979–2015, before turning negative at 1979–2016 and finally clearing a two-standard-deviation threshold with the 1979–2019 trend (Figure 7). Although the nine regions vary greatly in the sequence of their trend values, by the end of the record all nine have 1979–2021 negative trends that have magnitudes exceeding two standard deviations of the trend slope, some much more so than others (Figure 7). Furthermore, in a study covering the 42-year 1979–2020 period, Meier et al. (2022) subdivide the Arctic-wide sea ice cover into more regions and find negative trends for all 14 of them.
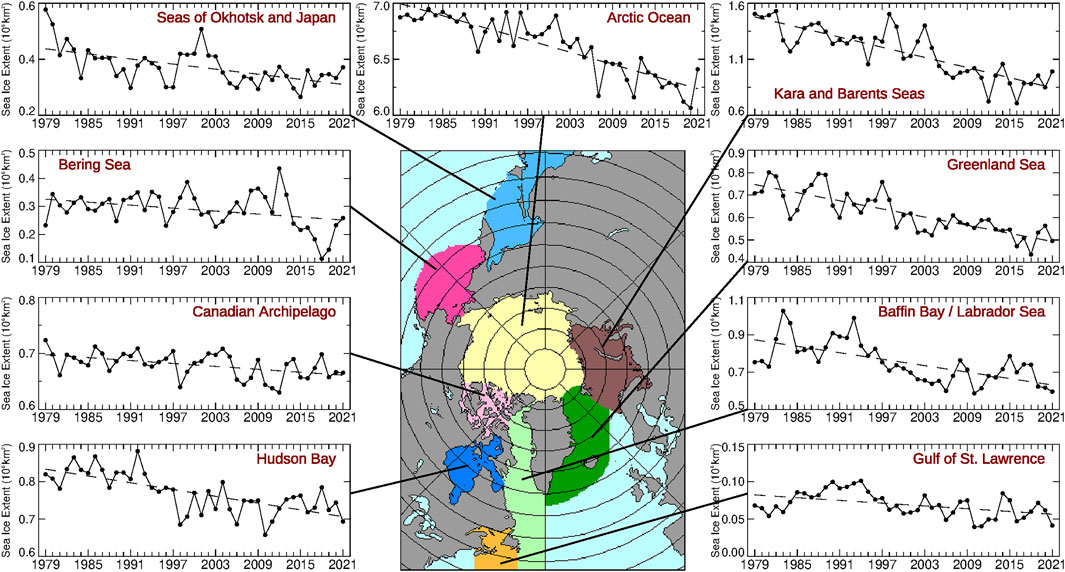
FIGURE 6. Yearly average sea ice extents and least-square trend lines, 1979–2021, for the following regions: Seas of Okhotsk and Japan; Bering Sea; Canadian Archipelago; Hudson Bay; Arctic Ocean; Kara and Barents Seas; Greenland Sea; Baffin Bay/Labrador Sea; and Gulf of St. Lawrence.
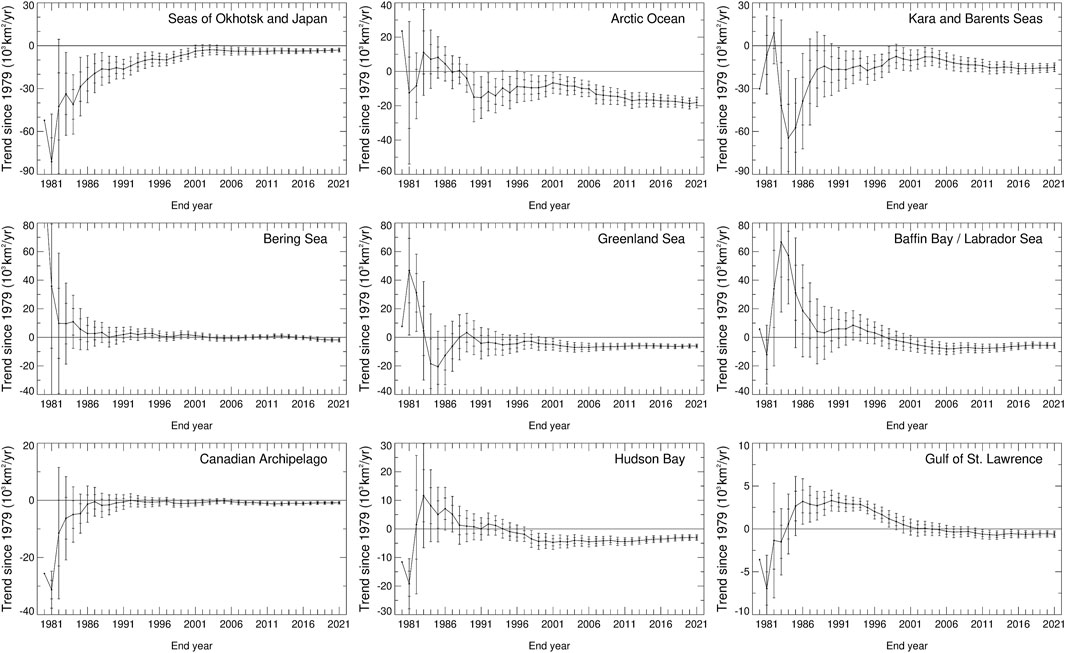
FIGURE 7. Linear-least-square slopes of the trend line in yearly average sea ice extents, from the 1979–1980 slope with only 2 years of data to the 1979–2021 slope with 43 years of data, for the following regions: Seas of Okhotsk and Japan; Arctic Ocean; Kara and Barents Seas; Bering Sea; Greenland Sea; Baffin Bay/Labrador Sea; Canadian Archipelago; Hudson Bay; and Gulf of St. Lawrence. The bars centered on each trend value after the first have ticks marking one and two standard deviations from the trend.
Many studies have examined sea ice conditions within individual regions and/or differences between regions. For instance, in the case of the Sea of Okhotsk, examinations have been done on the impacts on the sea ice cover of oceanic processes (e.g., Alfultis and Martin, 1987) and atmospheric conditions, including the Siberian High and Aleutian Low pressure systems (e.g., Parkinson, 1990; Rikiishi and Takatsuji, 2005), and the impact of sea ice formation, movement, and melting on the ocean (e.g., Nihashi et al., 2012). The contrast between generally rising sea ice extents in the Bering Sea and falling sea ice extents in the Seas of Okhostk and Japan in the early years of the record (Figure 6) have been examined in the context of atmospheric circulation patterns (e.g., Cavalieri and Parkinson, 1987; Rikiishi and Takatsuji, 2005); the sea ice patterns in the Labrador Sea, Greenland Sea, and Barents Sea have been examined in connection with the atmospheric North Atlantic Oscillation (NAO) (Fang and Wallace, 1994); and the relationship between the late-autumn sea ice cover of the Kara and Barents Seas and the winter NAO have been further examined in a modeling study that reproduces the observed relationship through simulated atmospheric internal variability (Warner et al., 2020).
3.3 Length of the sea ice season
To examine trends at a pixel-by-pixel level rather than on a regional level, Parkinson (1992) introduced the concept of the length of the sea ice season, defined for each pixel as the number of days in the year when the pixel had a calculated sea ice concentration of at least 15%. This definition intentionally avoided the complications of having to determine a start and end date for the sea ice season, which can be highly controversial given the fluid nature of the sea ice cover and the fact that winds can lead to a pixel becoming free of ice briefly even in the midst of winter.
When initially introduced, the length of the sea ice season calculations were done for the 1979–1986 period of the SMMR record and were done with ice-concentration cutoffs of 30% and 50% as well as 15%. The 1979–1986 results found a coherent picture of trends that was extremely consistent irrespective of the choice of ice-concentration cutoff. Results showed that during 1979–1986 the sea ice season shortened in the marginal ice zones of the eastern hemisphere and the Greenland Sea but lengthened in much of the western hemisphere other than the Greenland Sea (Parkinson, 1992).
As the passive-microwave data set has lengthened with the addition of the SSMI and SSMIS data, the picture of the length of the sea ice season trends has become increasingly dominated by shortening sea ice seasons (e.g., see Parkinson, 2014 for the 1979–2013 results). By now, with a 43-year 1979–2021 record, comparison of the length of the sea ice season for the start and end years of the record shows substantial differences (Figure 8), and the 43-year trends show shortened sea ice seasons throughout almost the entire marginal sea ice zone, with very few locations having a lengthened sea ice season and those almost entirely along the coast and hence subject to contamination of the gridded pixels by land presence (Figure 9).
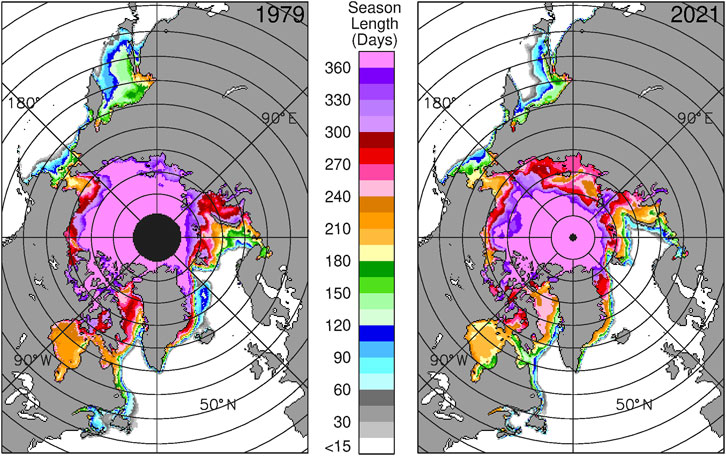
FIGURE 8. Length of the sea ice season in 1979 and 2021, as determined from satellite passive-microwave data by tallying, for each pixel, the number of days with calculated sea ice concentration at least 15%.
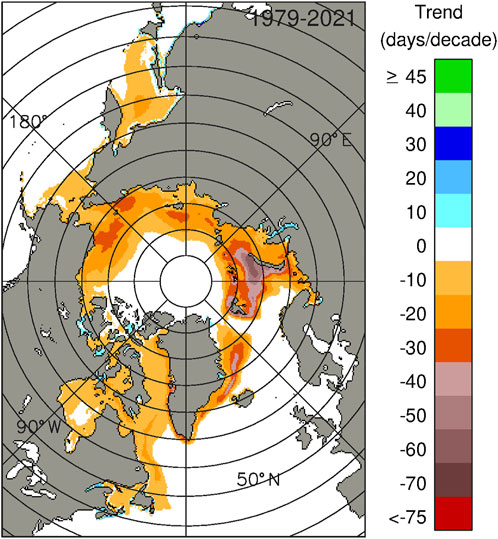
FIGURE 9. Trends in the length of the sea ice season, 1979–2021. For each pixel, the linear-least-square trend was calculated from the 43 yearly values of the length of the sea ice season at that pixel.
Visually, some particularly prominent contrasts between the 1979 and 2021 maps of sea ice season length are: 1) A sizeable portion of the eastern Sea of Okhotsk that had ice seasons lasting up to as much as 120 days in 1979 had no ice season at all in 2021; 2) in the northern Barents Sea to the north of Norway, there were locations with ice seasons exceeding 180 days in 1979 that had no ice season in 2021; 3) in the Arctic Ocean, the area with ice seasons exceeding 360 days is considerably smaller in 2021 than in 1979 (Figure 8). The highest magnitude trends for the 43-year period occur in the northern Barents Sea, where some pixels have negative trends with magnitudes exceeding 5 days/year (50 days/decade), equating to a shortening of the sea ice season by 210 days or more over the full 43 years (Figure 9).
4 Discussion
In significant part because of the convincing satellite-based record of Arctic sea ice decreases in the past several decades, sea ice has transitioned from being a relatively little-discussed climate variable to now often being a “poster child” for climate change discussions, frequently accompanied by pictures of forlorn polar bears seated uncomfortably on small remaining ice floes. This paper documents some important aspects of what the satellite record shows, including decreased sea ice concentrations, decreased sea ice extents, and decreased sea ice season lengths (Figures 1–9). However, these are far from the only important changes occurring in the Arctic sea ice cover.
Other satellite-based studies using passive-microwave data have documented substantial additional evidence of the declining Arctic sea ice cover, from decreases in multiyear ice coverage (Maslanik et al., 2011; Comiso, 2012; Bi et al., 2020) to earlier onset of melt of the ice and/or its snow cover (Markus et al., 2009; Bliss and Anderson, 2014, 2018; Singh et al., 2021). Satellite radar altimetry has been used to document thinning of the Arctic ice in the 2002–2018 period (Mallett et al., 2021), and satellite laser and radar altimetry have been used to document thinning of the ice in the 2018–2021 period, with thinning found to be especially large for multiyear ice (Kacimi and Kwok, 2022). Submarine sonar records have documented Arctic sea ice thinning in the second half of the 20th century (Rothrock et al., 1999; Yu et al., 2004). While the submarine records extend much further back in time than the satellite records, they are far less comprehensive geographically and far less frequent and regular in their observations. Satellite altimetry provides likely the best hope for eventual long-term records of Arctic sea ice thickness, although obtaining ice thickness from the satellite data remains challenging, hindered by such complicating factors as snow cover on the ice and clouds above the ice (e.g., Kwok et al., 2021; Mallett et al., 2021).
Studies extending the sea ice record back to well before the start of the satellite era include the data-based study of Walsh et al. (2016), synthesizing the sparse pre-satellite records with the more complete modern records into a database extending back to 1850, and the model-based study of Schweiger et al. (2019), presenting a reconstruction of Arctic sea ice thickness and volume back to 1901. The Schweiger et al. (2019) reconstruction was produced by forcing the Pan-Arctic Ice Ocean Modeling and Assimilation System (PIOMAS) with atmospheric data.
In light of the expectation of warming and the very close tie between temperature and sea ice formation and decay, Arctic sea ice decreases had been expected, although, overall, the ice extent decreases have occurred at a noticeably faster rate than model simulations predicted (e.g., Stroeve et al., 2007; Stroeve et al., 2012). As the sea ice extent decreases, the resulting lessened reflection of solar radiation back to space contributes to further regional warming and hence to the much greater warming experienced in recent decades in the Arctic than over the globe as a whole (Rantanen et al., 2022).
The decreases in Arctic sea ice have consequences ranging far beyond contributing to Arctic warming, as the interconnectedness of the global climate system ensures that major changes in one region of the globe will influence other regions as well. A study done with the Goddard Institute for Space Studies (GISS) climate model even found that 37% of the global warming simulated for a doubling of atmospheric carbon dioxide was due explicitly to the inclusion of sea ice calculations in the model simulation (Rind et al., 1995). Furthermore, the sea ice calculations increased the simulated warming at all latitudes, not just in the polar regions (Rind et al., 1995). Both observational and modeling studies have suggested that Arctic sea ice changes could impact mid-latitude weather events (e.g., Francis et al., 2009; Francis and Vavrus, 2012; Mori et al., 2014; Nakamura et al., 2016; McCusker et al., 2017; Luo et al., 2019; Cohen et al., 2021; Sun et al., 2022) and even the Indian Ocean Dipole (Chen et al., 2021). Other studies have questioned how great the influence might be (e.g., Overland, 2016; Blackport et al., 2019; Blackport and Screen, 2021); but given the interconnectedness of the system, some influence is almost assured despite the fact that scientists have not yet sorted out exactly what and how great the influence is.
In addition to the climate and weather impacts, Arctic sea ice changes impact many polar species, including most prominently polar bears (e.g., Stirling and Parkinson 2006; Stirling and Derocher, 2012) but going well beyond polar bears to the entire polar ecosystem, both marine and terrestrial (e.g., Post et al., 2013). Impacts also extend to human economic activities, among them the increased viability of shipping routes through the Arctic (Smith and Stephenson, 2013; Stephenson and Smith, 2015).
The analyzed Antarctic changes over the past several decades are not nearly so well aligned with global warming and sea ice expectations (e.g., Parkinson, 2019; Meier et al., 2022), but the Arctic results quite compellingly show a warming Arctic (e.g., Rantanen et al., 2022) and lessened sea ice coverage (this paper), and the satellite data have been crucial in solidly establishing these results.
Data availability statement
The datasets analyzed in this study are publicly available. The ice concentration data are at doi:10.5067/8GQ8LZQVL0VL (Cavalieri et al., 1996), and the ice extent data are at doi:10.5067/AE1XN2DQO5G4 (Parkinson and DiGirolamo, 2022).
Author contributions
CP conceived, wrote, revised, and edited the article.
Funding
This work was funded by the National Aeronautics and Space Administration (NASA) Earth Science Division.
Acknowledgments
The author greatly appreciates the help provided by Nick DiGirolamo of Science Systems and Applications, Inc. (SSAI) in generating the figures. Thanks also go to the organizers of this special issue on Women in Remote Sensing, highlighting the contributions that women have made to remote sensing science over the years.
Conflict of interest
The author declares that the research was conducted in the absence of any commercial or financial relationships that could be construed as a potential conflict of interest.
Publisher’s note
All claims expressed in this article are solely those of the authors and do not necessarily represent those of their affiliated organizations, or those of the publisher, the editors and the reviewers. Any product that may be evaluated in this article, or claim that may be made by its manufacturer, is not guaranteed or endorsed by the publisher.
References
Alfultis, M. A., and Martin, S. (1987). Satellite passive microwave studies of the Sea of Okhotsk ice cover and its relation to oceanic processes, 1978-1982. J. Geophys. Res. 92 (C12), 13013–13028. doi:10.1029/jc092ic12p13013
Barry, R. G., Serreze, M. C., Maslanik, J. A., and Preller, R. H. (1993). The Arctic sea ice-climate system: Observations and modeling. Rev. Geophys. 31 (4), 397–422. doi:10.1029/93rg01998
Bi, H., Liang, Y., Wang, Y., Liang, X., Zhang, Z., Du, T., et al. (2020). Arctic multiyear sea ice variability observed from satellites: A review. J. Oceanol. Limnol. 38, 962–984. doi:10.1007/s00343-020-0093-7
Blackport, R., and Screen, J. A. (2021). Observed statistical connections overestimate the causal effects of Arctic sea ice changes on midlatitude winter climate. J. Clim. 34, 3021–3038. doi:10.1175/jcli-d-20-0293.1
Blackport, R., Screen, J. A., van der Wiel, K., and Bintanja, R. (2019). Minimal influence of reduced Arctic sea ice on coincident cold winters in mid-latitudes. Nat. Clim. Chang. 9, 697–704. doi:10.1038/s41558-019-0551-4
Bliss, A. C., and Anderson, M. R. (2014). Snowmelt onset over Arctic sea ice from passive microwave satellite data: 1979-2012. Cryosphere 8, 2089–2100. doi:10.5194/tc-8-2089-2014
Bliss, A. C., and Anderson, M. R. (2018). Arctic sea ice melt onset timing from passive microwave-based and surface air temperature-based methods. J. Geophys. Res. Atmos. 123, 9063–9080. doi:10.1029/2018JD028676
Cavalieri, D. J., and Parkinson, C. L. (1987). On the relationship between atmospheric circulation and the fluctuations in the sea ice extents of the Bering and Okhotsk seas. J. Geophys. Res. 92 (C7), 7141–7162. doi:10.1029/jc092ic07p07141
Cavalieri, D. J., Parkinson, C. L., Gloersen, P., and Zwally, H. J. (1996). Sea ice concentrations from Nimbus-7 SMMR and DMSP SSM/I-SSMIS passive microwave data, version 1. NASA National Snow and Ice Data Center Distributed Active Archive Center. Boulder, Colorado, United States. updated yearly. doi:10.5067/8GQ8LZQVL0VL
Cavalieri, D. J., Parkinson, C. L., Gloersen, P., Comiso, J. C., and Zwally, H. J. (1999). Deriving long-term time series of sea ice cover from satellite passive-microwave multisensor data sets. J. Geophys. Res. 104 (C7), 15803–15814. doi:10.1029/1999JC900081
Cavalieri, D. J., Parkinson, C. L., DiGirolamo, N., and Ivanoff, A. (2012). Intersensor calibration between F13 SSMI and F17 SSMIS for global sea ice data records. IEEE Geosci. Remote Sens. Lett. 9 (2), 233–236. doi:10.1109/LGRS.2011.2166754
Chen, P., Sun, B., Wang, H., and Zhu, B. (2021). Possible impacts of December Laptev Sea ice on Indian Ocean Dipole conditions during spring. J. Clim. 34, 6927–6943. doi:10.1175/jcli-d-20-0980.1
Cohen, J., Agel, L., Barlow, M., Garfinkel, C. I., and White, I. (2021). Linking Arctic variability and change with extreme winter weather in the United States. Science 373 (6559), 1116–1121. doi:10.1126/science.abi9167
Comiso, J. C., Parkinson, C. L., Gersten, R., and Stock, L. (2008). Accelerated decline in the Arctic sea ice cover. Geophys. Res. Lett. 35, L01703. doi:10.1029/2007GL031972
Comiso, J. C. (2012). Large decadal decline of the Arctic multiyear ice cover. J. Clim. 25, 1176–1193. doi:10.1175/JCLI-D-11-00113.1
Draper, N. R., and Smith, H. (1981). Applied regression analysis. second edition. New York: John Wiley, 709 p.
Fang, Z., and Wallace, J. M. (1994). Arctic sea ice variability on a timescale of weeks and its relation to atmospheric forcing. J. Clim. 7, 1897–1914. doi:10.1175/1520-0442(1994)007<1897:asivoa>2.0.co;2
Francis, J. A., and Vavrus, S. J. (2012). Evidence linking Arctic amplification to extreme weather in mid-latitudes. Geophys. Res. Lett. 39, L06801. doi:10.1029/2012GL051000
Francis, J. A., Chan, W., Leathers, D., Miller, J. R., and Veron, D. E. (2009). Winter northern hemisphere weather patterns remember summer Arctic sea ice extent. Geophys. Res. Lett. 36, L07503. doi:10.1029/2009GL037274
Gloersen, P., Campbell, W. J., Cavalieri, D. J., Comiso, J. C., Parkinson, C. L., and Zwally, H. J. (1992). Arctic and Antarctic sea ice, 1978-1987: Satellite passive-microwave observations and analysis. Washington, D.C.: National Aeronautics and Space Administration, 290 p. NASA SP-511.
Johannessen, O. M., Miles, M., and Bjørgo, E. (1995). The Arctic’s shrinking sea ice. Nature 376, 126–127. doi:10.1038/376126a0
Kacimi, S., and Kwok, R. (2022). Arctic snow depth, ice thickness, and volume from ICESat-2 and CryoSat-2: 2018-2021. Geophys. Res. Lett. 49, e2021GL097448. doi:10.1029/2021GL097448
Kay, J. E., L’Ecuyer, T., Gettelman, A., Stephens, G., and O’Dell, C. (2008). The contribution of cloud and radiation anomalies to the 2007 Arctic sea ice extent minimum. Geophys. Res. Lett. 35, L08503. doi:10.1029/2008GL033451
Kwok, R., Petty, A. A., Bagnardi, M., Kurtz, N. T., Cunningham, G. F., Ivanoff, A., et al. (2021). Refining the sea surface identification approach for determining freeboards in the ICESat-2 sea ice products. Cryosphere 15, 821–833. doi:10.5194/tc-15-821-2021
Luo, D., Chen, X., Overland, J., Simmonds, I., Wu, Y., and Zhang, P. (2019). Weakened potential vorticity barrier linked to recent winter Arctic sea ice loss and midlatitude cold extremes. J. Clim. 32, 4235–4261. doi:10.1175/jcli-d-18-0449.1
Maksym, T. (2019). Arctic and Antarctic sea ice change: Contrasts, commonalities, and causes. Ann. Rev. Mar. Sci. 11, 187–213. doi:10.1146/annurev-marine-010816-060610
Mallett, R. D. C., Stroeve, J. C., Tsamados, M., Landy, J. C., Willatt, R., Nandan, V., et al. (2021). Faster decline and higher variability in the sea ice thickness of the marginal Arctic seas when accounting for dynamic snow cover. Cryosphere 15 (5), 2429–2450. doi:10.5194/tc-15-2429-2021
Markus, T., Stroeve, J. C., and Miller, J. (2009). Recent changes in Arctic sea ice melt onset, freezeup, and melt season length. J. Geophys. Res. 114, C12024. doi:10.1029/2009JC005436
Maslanik, J. A., Serreze, M. C., and Barry, R. G. (1996). Recent decreases in Arctic summer ice cover and linkages to atmospheric circulation anomalies. Geophys. Res. Lett. 23 (13), 1677–1680. doi:10.1029/96GL01426
Maslanik, J., Stroeve, J., Fowler, C., and Emery, W. (2011). Distribution and trends in Arctic sea ice age through spring 2011. Geophys. Res. Lett. 38, L13502. doi:10.1029/2011GL047735
McCusker, K. E., Kushner, P. J., Fyfe, J. C., Sigmond, M., Kharin, V. V., and Bitz, C. M. (2017). Remarkable separability of circulation response to Arctic sea ice loss and greenhouse gas forcing. Geophys. Res. Lett. 44, 7955–7964. doi:10.1002/2017GL074327
Meier, W. N., Hovelsrud, G. K., van Oort, B. E. H., Key, J. R., Kovacs, K. M., Michel, C., et al. (2014). Arctic sea ice in transformation: A review of recent observed changes and impacts on biology and human activity. Rev. Geophys. 51, 185–217. doi:10.1002/2013RG000431
Meier, W. N., Stewart, J. S., Windnagel, A., and Fetterer, F. M. (2022). Comparison of hemispheric and regional sea ice extent and area trends from NOAA and NASA passive microwave-derived climate records. Remote Sens. 14, 619. doi:10.3390/rs14030619
Mori, M., Watanabe, M., Shiogama, H., Inoue, J., and Kimoto, M. (2014). Robust Arctic sea-ice influence on the frequent Eurasian cold winters in past decades. Nat. Geosci. 7, 869–873. doi:10.1038/NGEO2277
Nakamura, T., Yamazaki, K., Iwamoto, K., Honda, M., Miyoshi, Y., Ogawa, Y., et al. (2016). The stratospheric pathway for Arctic impacts on midlatitude climate. Geophys. Res. Lett. 43, 3494–3501. doi:10.1002/2016GL068330
Nghiem, S. V., Hall, D. K., Rigor, I. G., Li, P., and Neumann, G. (2014). Effects of Mackenzie River discharge and bathymetry on sea ice in the Beaufort Sea. Geophys. Res. Lett. 41, 873–879. doi:10.1002/2013GL058956
Nihashi, S., Ohshima, K. I., and Kimura, N. (2012). Creation of a heat and salt flux dataset associated with sea ice production and melting in the Sea of Okhotsk. J. Clim. 25, 2261–2278. doi:10.1175/jcli-d-11-00022.1
Overland, J. E. (2016). Is the melting Arctic changing midlatitude weather? Phys. Today 69 (3), 38–43. doi:10.1063/pt.3.3107
Parkinson, C. L., and Cavalieri, D. J. (1989). Arctic sea ice 1973-1987: Seasonal, regional, and interannual variability. J. Geophys. Res. 94 (C10), 14499–14523. doi:10.1029/jc094ic10p14499
Parkinson, C. L. (1990). The impact of the Siberian High and Aleutian Low on the sea-ice cover of the Sea of Okhotsk. Ann. Glaciol. 14, 226–229. doi:10.1017/s0260305500008636
Parkinson, C. L. (1992). Spatial patterns of increases and decreases in the length of the sea ice season in the north polar region, 1979-1986. J. Geophys. Res. 97 (C9), 14377–14388. doi:10.1029/92JC01367
Parkinson, C. L., Cavalieri, D. J., Gloersen, P., Zwally, H. J., and Comiso, J. C. (1999). Arctic sea ice extents, areas, and trends, 1978-1996. J. Geophys. Res. 104 (C9), 20837–20856. doi:10.1029/1999JC900082
Parkinson, C. L., and Comiso, J. C. (2013). On the 2012 record low Arctic sea ice cover: Combined impact of preconditioning and an August storm. Geophys. Res. Lett. 40, 1356–1361. doi:10.1002/grl.50349
Parkinson, C. L. (2014). Spatially mapped reductions in the length of the Arctic sea ice season. Geophys. Res. Lett. 41, 4316–4322. doi:10.1002/2014GL060434
Parkinson, C. L., and DiGirolamo, N. E. (2016). New visualizations highlight new information on the contrasting Arctic and Antarctic sea-ice trends since the late 1970s. Remote Sens. Environ. 183, 198–204. doi:10.1016/j.rse.2016.05.020
Parkinson, C. L. (2019). A 40-y record reveals gradual Antarctic sea ice increases followed by decreases at rates far exceeding the rates seen in the Arctic. Proc. Natl. Acad. Sci. U. S. A. 116 (29), 14414–14423. doi:10.1073/pnas.1906556116
Parkinson, C. L., and DiGirolamo, N. E. (2021). Sea ice extents continue to set new records: Arctic, Antarctic, and global results. Remote Sens. Environ. 267, 112753. doi:10.1016/j.rse.2021.112753
Parkinson, C. L., and DiGirolamo, N. E. (2022). Arctic monthly sea ice extents. NASA National Snow and Ice Data Center Distributed Active Archive Center. Boulder, Colorado, United States. doi:10.5067/AE1XN2DQO5G4 updated yearly
Post, E., Bhatt, U. S., Bitz, C. M., Brodie, J. F., Fulton, T. L., Hebblewhite, M., et al. (2013). Ecological consequences of sea-ice decline. Science 341 (6145), 519–524. doi:10.1126/science.1235225
Rantanen, M., Karpechko, A. Y., Lipponen, A., Nordling, K., Hyvarinen, O., Ruosteenoja, K., et al. (2022). The Arctic has warmed nearly four times faster than the globe since 1979. Commun. Earth Environ. 3, 168. doi:10.1038/s43247-022-00498-3
Rikiishi, K., and Takatsuji, S. (2005). On the growth of ice cover in the Sea of Okhotsk with special reference to its negative correlation with that in the Bering Sea. Ann. Glaciol. 42, 380–388. doi:10.3189/172756405781812619
Rind, D., Healy, R., Parkinson, C., and Martinson, D. (1995). The role of sea ice in 2 x CO2 climate model sensitivity. Part 1: The total influence of sea ice thickness and extent. J. Clim. 8 (3), 449–463. doi:10.1175/1520-0442(1995)008<0449:trosii>2.0.co;2
Rothrock, D. A., Yu, Y., and Maykut, G. A. (1999). Thinning of the Arctic sea-ice cover. Geophys. Res. Lett. 26 (23), 3469–3472. doi:10.1029/1999gl010863
Schweiger, A. J., Wood, K. R., and Zhang, J. (2019). Arctic sea ice volume variability over 1901-2010: A model-based reconstruction. J. Clim. 32, 4731–4752. doi:10.1175/JCLI-D-19-0008.1
Simmonds, I., and Rudeva, I. (2012). The great Arctic cyclone of August 2012. Geophys. Res. Lett. 39, L23709. doi:10.1029/2012GL054259
Singh, R. K., Singh, T. V., and Singh, U. S. (2021). Long-term observation of the Arctic sea ice melt onset from microwave radiometry. J. Indian Soc. Remote Sens. 49, 357–364. doi:10.1007/s12524-020-01220-6
Smith, L. C., and Stephenson, S. R. (2013). New trans-Arctic shipping routes navigable by midcentury. Proc. Natl. Acad. Sci. U. S. A. 110 (13), E1191–E1195. doi:10.1073/pnas.1214212110
Stephenson, S. R., and Smith, L. C. (2015). Influence of climate model variability on projected Arctic shipping futures. Earth's Future 3, 331–343. doi:10.1002/2015ef000317
Stirling, I., and Derocher, A. E. (2012). Effects of climate warming on polar bears: A review of the evidence. Glob. Chang. Biol. 18, 2694–2706. doi:10.1111/j.1365-2486.2012.02753.x
Stirling, I., and Parkinson, C. L. (2006). Possible effects of climate warming on selected populations of polar bears (Ursus maritimus) in the Canadian Arctic. Arctic 59 (3), 261–275. doi:10.14430/arctic312
Stroeve, J., Holland, M. M., Meier, W., Scambos, T., and Serreze, M. (2007). Arctic sea ice decline: Faster than forecast. Geophys. Res. Lett. 34, L09501. doi:10.1029/2007GL029703
Stroeve, J. C., Kattsov, V., Barrett, A., Serreze, M., Pavlova, T., Holland, M., et al. (2012). Trends in Arctic sea ice extent from CMIP5, CMIP3 and observations. Geophys. Res. Lett. 39, L16502. doi:10.1029/2012GL052676
Sun, J., Liu, S., Cohen, J., and Yu, S. (2022). Influence and prediction value of Arctic sea ice for spring Eurasian extreme heat events. Commun. Earth Environ. 3, 172. doi:10.1038/s43247-022-00503-9
Taylor, J. R. (1997). An introduction to error analysis: The study of uncertainties in physical measurements. second edition. Sausalito, California: University Science Books, 327 p.
Vihma, T. (2014). Effects of Arctic sea ice decline on weather and climate: A review. Surv. Geophys. 35, 1175–1214. doi:10.1007/s10712-014-9284-0
Walsh, J. E. (2013). Melting ice: What is happening to Arctic sea ice, and what does it mean for us? Oceanogr. 26 (2), 171–181. doi:10.5670/oceanog.2013.19
Walsh, J. E., Fetterer, F., Stewart, J. S., and Chapman, W. L. (2016). A database for depicting Arctic sea ice variations back to 1850. Geogr. Rev. 107 (1), 89–107. doi:10.1111/j.1931-0846.2016.12195.x
Warner, J. L., Screen, J. A., and Scaife, A. A. (2020). Links between Barents-Kara sea ice and the extratropical atmospheric circulation explained by internal variability and tropical forcing. Geophys. Res. Lett. 47 (1), e2019GL085679. doi:10.1029/2019GL085679
Yu, Y., Maykut, G. A., and Rothrock, D. A. (2004). Changes in the thickness distribution of Arctic sea ice between 1958-1970 and 1993-1997. J. Geophys. Res. 109, C08004. doi:10.1029/2003JC001982
Zhang, J., Lindsay, R., Schweiger, A., and Steele, M. (2013). The impact of an intense summer cyclone on 2012 Arctic sea ice retreat. Geophys. Res. Lett. 40, 720–726. doi:10.1002/grl.50190
Keywords: sea ice, Arctic sea ice, Arctic, climate change, polar climate change, satellite Earth observations
Citation: Parkinson CL (2022) Arctic sea ice coverage from 43 years of satellite passive-microwave observations. Front. Remote Sens. 3:1021781. doi: 10.3389/frsen.2022.1021781
Received: 17 August 2022; Accepted: 20 September 2022;
Published: 21 October 2022.
Edited by:
Erin Bunting, Michigan State University, United StatesReviewed by:
Grant Gunn, University of Waterloo, CanadaSamuel Tuttle, Syracuse University, United States
John Walsh, University of Alaska Fairbanks, United States
Copyright© 2022 Parkinson. This article is a U.S. Government work and is in the public domain in the United States. This is an open-access article distributed under the terms of the Creative Commons Attribution License (CC BY). The use, distribution or reproduction in other forums is permitted, provided the original author(s) and the copyright owner(s) are credited and that the original publication in this journal is cited, in accordance with accepted academic practice. No use, distribution or reproduction is permitted which does not comply with these terms.
*Correspondence: Claire L. Parkinson, claire.l.parkinson@nasa.gov