Characteristics of a pre-monsoon dryline atmospheric boundary layer over the rain shadow region: A case study
 Raman Solanki
 Neelam Malap
 K. Gayatri
 Y. Jaya Rao
 Thara Prabhakaran
- Indian Institute of Tropical Meteorology (IITM), Ministry of Earth Sciences, Pune, India
A dryline is the zone of distinct moisture gradient separating warm, moist, and hot, dry air masses. It is usually associated with mesoscale phenomena and plays a significant role in atmospheric boundary layer (ABL) dynamics including initiation of convection/thunderstorms. In the tropical Indian region, these dryline conditions are normally associated with the pre-monsoon season. In the present study, dryline characteristics over a rain shadow region in the Indian subcontinent were investigated utilizing observations and Weather Research and Forecasting (WRF) model from 28 to 30 May 2019. Based upon Wind Profiler Radar and MicroWave Radiometer Profiler measurements, the ABL characteristics were investigated. Interestingly, the ABL height was found to evolve up to 5 km with the horizontal wind vectors oscillating between north-westerly and north-easterly flow. During the intense ABL deepening, stronger downdraft cores were observed in comparison with the updraft cores. The stronger downdrafts entrained free-tropospheric dry air thereby further deepening the ABL. Based upon the entrainment velocity estimates at the ABL top and the variations in potential temperature, the dynamic entrainment fluxes were estimated and further implemented for evaluating two slab models to recreate the ABL growth. With this analysis, we demonstrate the significant contribution of entrainment fluxes on ABL growth during dryline conditions.
1 Introduction
The Western Ghats (WG) in India is a region of considerable topographical variation and large heterogeneity in rainfall distribution, with heavy precipitation concentrated on the western side and a reduction to 70%–80% (of the windward side rainfall) within a distance of 100 km on the eastern rain shadow side (Gunnell, 1997). The sea breeze circulation is limited to 200 km along the western coastline, often accompanied by a line of clouds at the mountain summits parallel to the coastline. The rain shadow region of the WG is a region under significant drought conditions and is often characterized by extreme heat and lack of moisture during the pre-monsoon period (Prabha et al., 2011). The atmospheric boundary layer (ABL) characteristics of this dry convection are a topic of discussion in this paper with detailed observations. The pre-monsoon season is characterized by dry northwesterly and moist southwesterly winds over south Asia. As a consequence, the dry-moist convergence zone known as the dryline often appears over the rain shadow region of the WG. The dryline is primarily a boundary between warm, moist air and hot, dry air, thus being a favored zone for the initiation of severe weather (Ziegler and Rasmussen, 1998). The dryline boundary layer characteristics in the pre-monsoon are seldom studied in detail. However, Indian drylines are responsible for initiating severe thunderstorms during the pre-monsoon months (Weston, 1972; Campbell et al., 2014).
The pre-monsoon season brings moist south-westerly winds intruding into the dry North westerly winds. This situation forms a junction between the moist and dry air masses, which typically causes severe storms. The narrow convergence line (considered to be a dryline) is parallel to the east coast of India and may sometimes propagate inland, depending on the synoptic-scale winds. The convergence zone further extends to the northeastern region of India, towards the Himalayas. Early studies indicate that cumulonimbus clouds are formed at the edge of the moist regions along these drylines (Weston, 1972; Ziegler and Rasmussen 1998; Weckwerth and Parsons, 2006). A climatological study of drylines over India has been reported by Akter and Tsuboki (2017). Prabha et al. (2011) used high-resolution simulations with the Advanced Research Weather Research and Forecasting (ARW) model to investigate the low-level jets and atmospheric streams of water vapor over the rain shadow region during pre-monsoon conditions. They have also discussed the deep dry convection over the rain shadow region with large eddies scaling the entire thickness of the deep ABL through the deeper and wider convective cells. Sathyanadh et al. (2017) investigated the diurnal variation of ABL height from the reanalysis data and a few observations during the Cloud Aerosol Interaction and Precipitation Enhancement EXperiment (CAIPEEX). Based on the diurnal variation of ABL height, large growth rates of ABL height were found to be associated with extremely dry conditions, low soil moisture, subsidence and intense heating of the surface as noted from the heat flux. The large ABL height (above 3,500 m) over inland locations in the rain shadow region during the pre-monsoon months was also discussed in Sathyanadh et al. (2017). A strong linkage of the ABL height with the eddy diffusivities from reanalysis data was noted. The ABL started to grow from 0900 h and continued to grow until 1800 h local time; such deep ABL was assisted initially by the stronger convection at the ground, and further sustained by the dry air entrainment into the ABL due to mid-level anticyclonic conditions (van Heerwaarden et al., 2009). The large growth rate of ABL was indeed supported by buoyant thermals and a significant contribution from non-local eddy diffusivity. The study pointed to the fact that entrainment effects may be significant in these conditions.
Understanding the dynamics of deep boundary layers is of vital importance considering their potential to affect the regional circulation (Wang et al., 2019; Zhang et al., 2022), aerosol transportation (Huang et al., 2014), and drought aggravation (Liu et al., 2020). The topic has significant importance in the global warming scenario as dry regions are becoming drier and wet regions are becoming wetter (Kumar et al., 2015). In the present study, we investigate the turbulent characteristics of extremely dry and deep boundary layers over the rain shadow region in the tropical Indian subcontinent, where droughts are quite common. It may also be noted that boundary layer research over the arid regions could be a crucial aspect to improve the understanding of the exchange of lower atmospheric mass and heat with the free troposphere and vice versa through deep boundary layers. The deep ABL is empowered with the capacity to affect the formation of convective cloudiness and the climatic system as a whole through the entrainment of thermal energy, water vapor, aerosols, and other admixtures across its upper boundary (Zilitinkevich et al., 2012).
In this study, the dynamic characteristics of the deep ABL during a dryline event are investigated through a combination of Wind Profiler Radar, MicroWave Radiometer Profiler and eddy-covariance tower measurements. Details of these instruments, observational sites, and data analysis methods used are provided in the subsequent sections. The unique combination of these measurements has the potential to improve the understanding of the ABL dynamics by providing an insight into the complex feedback between surface flux and the free troposphere (Brugger et al., 2018; Helbig et al., 2021; Rey-Sanchez et al., 2021; Zhang et al., 2022). With these measurements, we have estimated the ABL height and the turbulent fluxes at the lower and upper boundary of ABL. Moreover, the ABL convection is investigated based on the vertical wind profile measurements to quantify the updrafts/downdrafts timing and strength. The ABL updraft and downdraft fraction, and duration of updrafts and downdrafts are discussed in this study for the dry convective ABL. Moreover, since entrainment is the primary process by which ABL depth increases (Boers et al., 1984; Brooks and Fowler, 2012; Liu et al., 2021; Su et al., 2022; Zhang et al., 2022) we have evaluated the ability of two slab models in ABL evolution by incorporating the comprehensive set of measurements and dynamic entrainment coefficient.
2 Observational sites and instrumentation
Indian Institute of Tropical Meteorology (IITM) established observational facilities at Tuljapur (18.01°N, 76.06°E, 648 m a.m.s.l), and Solapur (17.6°N, 75.9°E, 510 m a.m.s.l.) in Maharashtra State, India as part of CAIPEEX. These observational sites are located on the leeward side of WG and part of the arid rain shadow region. Figure 1A shows the satellite map of the Indian subcontinent observed by MODIS EOSIDS on 26 May 2019. The box shown in this figure represents the area covering part of WG and location of observational sites. Terrain characteristics of the region (marked as the box in Figure 1A) along with the location of the sites are shown in Figure 1B. The dry convection is predominant and devoid of clouds as depicted by the satellite image of the Indian subcontinent in Figure 1A. Measurements of aerosols, clouds, precipitation and other meteorological parameters are made with high range and time resolutions using multiple instruments. Co-located measurements made at Tuljapur using Wind Profiler Radar (WPR) and Microwave Radiometer Profiler (MWRP) along with concurrent meteorological tower observations at Solapur have been utilized in the present study. The chosen case study of the dryline is associated with the pre-monsoon period of 2019 and is characterized by significant dry conditions. We present a detailed analysis of this dryline event based upon observations from the WPR, MWRP and surface flux measurements conducted during Phase IV of the CAIPEEX campaign.
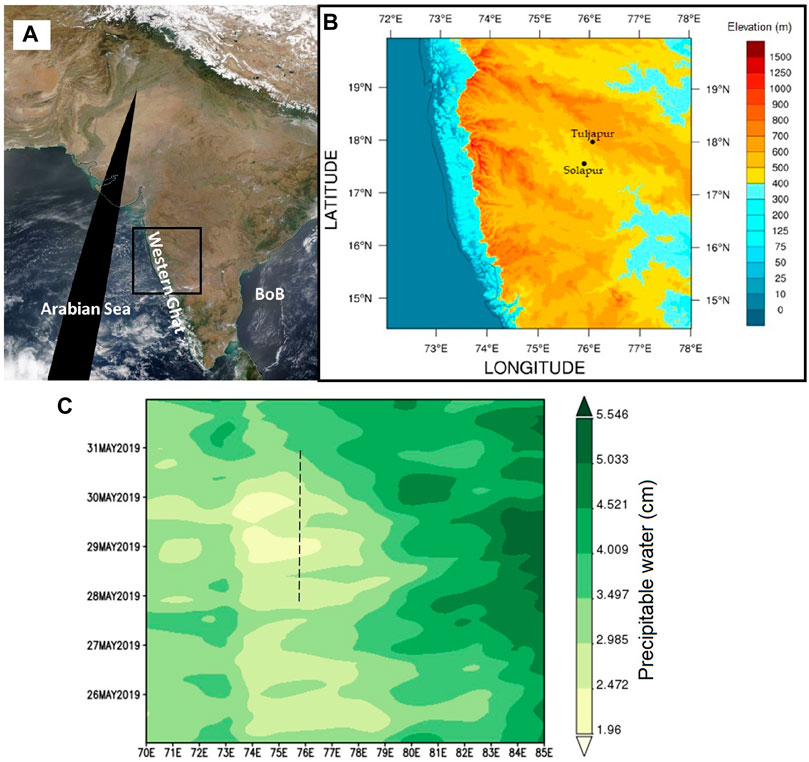
FIGURE 1. (A) Satellite image of the Indian subcontinent on 26 May 2019 from MODIS EOSDIS Worldview. (B) Terrain map (zoomed part of the box shown in panel (A) showing the location of the measurement sites, Tuljapur and Solapur, in the rain shadow region of the Western Ghats. (C) The Hovmoller diagram of the precipitable water. Dashed line in the panel (C) indicates the location and duration correspond to the present study. Hovmoller diagram is generated using hourly averaged data over the region (17–20.5°N) and (70–85°E) for the period 25(00UTC)-31(23UTC) May 2019 (0.5 × 0.625 degree resolution data from MERRA-2 Model M2T1NXLND v5.12.4 product).
2.1 Wind profiler radar
The WPR systems operating at UHF/VHF bands are capable of monitoring vertical profiles of 3-D winds on a continuous basis, with high range and time resolutions, during all weather conditions. Direct measurement of vertical velocity is the unique capability of these systems. It works on the phenomenon of backscattering of electromagnetic radiation due to fluctuations in the radio-refractive index (n) in the atmosphere, induced primarily by turbulence and known as Bragg scattering. The L-band WPR system, utilized in the present study, operating at 1,280 MHz has been set up at Tuljapur during Phase IV of CAIPEEX campaign to probe the lower atmospheric dynamics in the height region 150 m–5.0 km, depending on the availability of radio refractive index gradients and water vapor content, during non-precipitating conditions (Srinivasulu et al., 2011). The strength of the backscatter signal is expected to enhance during the monsoon period since vertical profiling of winds and turbulence is possible for the entire lower and middle troposphere including the south-westerly low-level jet (LLJ), a characteristic feature of the monsoon season, and parts of the tropical easterly jet (TEJ) predominant over the Indian peninsular region during the monsoon.
This WPR is a compact and transportable system commercially developed for IITM by M/s Astra Microwave Products Ltd. India. The WPR utilizes the Doppler Beam Swing (DBS) technique with a 5-beam scan in two orthogonal planes (EW and NS) of the antenna array. The backscattered signal sampled, in the time domain, at each range gate is translated into Doppler Spectrum using FFT and then subjected to statistical analysis to derive three low-order moments i.e., zeroth, first and second, representing the returned power (arbitrary units), Doppler and width of the Doppler spectrum respectively. Profiles of Doppler for three non-coplanar beams are used to derive the wind components i.e., Zonal, Meridional and Vertical. It may be noted that L-band WPR systems are more sensitive to rain and clouds as compared to the VHF/UHF band radars (Raghavan, 2013), but less sensitive than common weather radar (Ku and Ka bands). Thus, wind measurements made by L-band profiler during precipitation may not represent true winds but are contaminated with fall velocities. The measurement accuracy and uncertainty are primarily related to the beam pointing accuracy in orthogonal planes of the antenna array including in vertical direction and also the degree of detectability which is proportional to the intensity of prevailed turbulence within the probing volume. Co-located Radiosonde measured wind products are being used as a reference to quantify the error in wind measurements. The technical and experimental specifications of the WPR system used in the present study are given in Table 1. We use the range corrected backscattered signal strength expressed as Signal to Noise Ratio (SNR), after applying the data quality checks with a threshold of −22 dB.
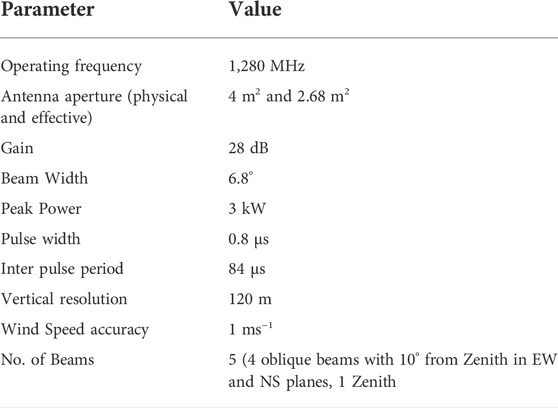
TABLE 1. Specifications of the wind profiler radar.
2.2 MicroWave radiometer profiler
MWRP (Radiometrics Inc., United States; Model MP-3000A), is a passive remote profiling instrument that derives the temperature, relative humidity and water vapor up to the height of 10 km and colocated with the WPR at Tuljapur. It measures brightness temperatures in 21 frequencies in K-band (22–30 GHz) and V- band (51–59 GHz) to measure water vapour and temperature respectively. The MWRP provides measurements in the height region 50 m–10 km with a time resolution of 48 s and variable range resolutions (resolution of 50 m below 500, 100 m resolution at heights 500–2,000 m and 250 m resolution above 2,000 m). The instrument undergoes periodic liquid nitrogen (LN2) and Tip calibrations to maintain the accuracy of the measurements. Several authors discussed the uncertainties in Radiometer measurements (Racette and Lang, 2005; Westwater, 2011; Kaisti et al., 2014). We used zenith retrievals in the present study. The potential temperatures, derived from MWRP retrieved temperature profiles, have been used to estimate the ABL height by adopting the parcel method (Holzworth, 1964; Holzworth, 1967; Granados-Muñoz et al., 2012; Collaud-Coen et al., 2014). ABL height is registered as the height at which an air parcel rises adiabatically from the ground, and the temperature profile crosses the dry adiabatic value.
Balaji et al. (2017) discussed the WPR and MWRP data accuracies in comparison with concurrent Radiosonde (RS) measurements. Good correlation between MWRP and RS measurements of temperature was noticed with correlation coefficient of 0.99, root mean square error (RMSE) was 1.91 °C and mean bias was 1.04°C; whereas water vapor mixing ratio measurements also showed good correlation with correlation coefficient 0.93, RMSE was 1.75 g kg−1 and mean bias was −0.16 g kg−1. MWRP estimates of Total Precipitable Water (TPW, column integrated liquid water) were inter-compared with RS, the correlation coefficient was found to be 0.86 while RMSE was 0.24 cm. Comparison between zonal and meridional winds measured independently by WPR and RS up to a height of 5 km showed a good correlation with correlation coefficient of 0.85 (0.73), RMSE was 2.04 (2.05) ms−1 and mean bias was 0.34 (−0.02) ms−1 for zonal (meridional) components.
2.3 Micrometeorological tower
In order to elucidate the surface layer turbulence characteristics, we have used the micrometeorological dataset from a 50-m instrumented tower erected over non-irrigated grassland at Solapur, located approximately at an aerial distance of 38 km from the Tuljapur site in South-West direction. The micrometeorological tower is equipped with multi-level instruments for eddy-covariance measurements (sonic anemometer Gill Windmaster-pro, LI-COR CO2 and water vapor Analyser (LI-7200) at 4, 8, 20, and 40 m sampling at 10 Hz) and gradient measurements (all in one weather parameters T, RH, wind, pressure and rainfall using Gill Maximet GMX600). We used the LI-COR EddyPro software (LI-COR, United States) to estimate the 30-min averaged eddy-covariance fluxes and surface layer parameters, by applying necessary quality controls and data corrections (Chowdhuri et al., 2021). The processing of the raw data includes corrections for wind measurements offsets of the anemometer including angle of attack and tilt correction (Kaimal and Finnigan, 1994). Detrending of the time series was done by block averaging method, time lag between the anemometer and LI-7200 was compensated by the covariance maximization method. Statistical tests for raw data screening were carried out by the methods of Vickers and Mahrt (1997) which include spike count/removal, amplitude resolution, drop outs, absolute limits, skewness and kurtosis.
3 Weather research and forecast model setup
We have also used the Weather Research and Forecasting model (WRF V3.9.1) for daily forecasts over the study region. The model setup has two two-way nested domains with 5 and 1 km grid resolution, respectively. The lowest model level is 25 m above the surface and the model top is at 20 km. The initial and boundary conditions are provided from the NCEP GFS (Global forecasting system) 1-degree forecasts and the boundary conditions are updated every 3 h. The model was initialized at 1800 UTC and hourly forecasts were generated for a 48-h period. More details on the detailed experimental setup and validation of forecasts can be found in Prabha et al. (2011) and Gayatri et al. (2022). In the present study, we considered the 550 × 600 km domain with 1 km grid resolution for the analysis. Based on the WRF model validation by Gayatri et al. (2022) against the surface measurements at Solapur, the mean bias error (MBE) for mean temperature (°C) was found to be 0.75, with low values of RMSE 1.15 and absolute error (MAE) 0.82. Similarly, for wind speed (ms−1) the forecasts MBE, RMSE, and MAE were found to be 2.17, 2.84, and 2.06 respectively. However, relative humidity (%) forecasts showed a strong negative bias (MBE equal to −7.13), and higher RMSE and MAE of 8.87 and 6.73 respectively, thereby suggesting a less accurate forecast of relative humidity. Moreover, the model performance in simulating the vertical structure of atmosphere was evaluated against the radiosonde measurements. The bias in the relative humidity varied from 2 to 5% at the lower levels (<12 km). A cold bias of 2°C was found in temperature forecasts below 15 km altitude. Similarly, a low bias of (±1 ms−1) was found for both horizontal wind components in the lower levels.
4 Methodology and data analysis
4.1 Atmospheric boundary layer height retrieval
The WPR measures the backscattered electromagnetic energy due to fluctuations in the refractive index induced by the turbulent eddies and is proportional to the refractive-index structure parameter (Cn2, White et al., 1991). The transition from the boundary layer to the free troposphere i.e., at the top of the ABL is in general associated with the strong radio refractive index gradients and thus sharp gradients in WPR measured SNR, as the backscattered signal strength is directly proportional to the Cn2, which exhibits a peak at the inversion capping the ABL (Wyngaard and LeMone, 1980). The detection of the peak in the SNR profile and the ABLH estimation can be achieved through a variety of technical algorithms (Angevine et al., 1994; Cohn and Angevine 2000; Bianco and Wilczak 2002; Lange et al., 2015; Singh et al., 2016; Solanki et al., 2021), although each technique has its own advantages and limitations. The ABL height retrieval is generally based on the combination of various techniques, as is usually the case with wind profiler-based ABL retrieval over complex mountainous topography (Singh et al., 2016; Solanki et al., 2021). In the present study, we used primarily the gradient method to retrieve the ABLH from WPR measurements i.e., height corresponding to the peak in the gradient profile of SNR. In addition, the retrieval algorithm is augmented with the threshold method during the non-sunshine hours. ABLH retrievals are further evaluated considering the growth rate of the ABL as suggested by Rey-Sanchez et al. (2021). The ABLH retrieval algorithm has been validated against the MWRP-based ABLH estimates and the correlation coefficient was found to be 0.87 (R2) between these two independent measurements. The diurnal cycle of ABL height estimates based upon MWRP and WPR measurements is illustrated in Figure 7. Based on the Student’s t-Test the differences in the ABL height estimates from the two independent measurements were found to be insignificant (p-value of 0.14). Nevertheless, it must be noted that the MWRP-based ABLH estimations are based upon the retrieved temperature profiles, while WPR measurements of SNR profiles are primarily sensitive to the turbulent fluctuations in refractive index gradients.
4.2 Updrafts and downdrafts
To gain direct insight into the vertical air motion in the ABL, we have utilized the WPR vertical velocity measurements. In this study the updraft/downdraft core properties have been quantified in terms of core duration, length and velocity. As per LeMone and Zisper (1980) and Giangrande et al. (2013) a core is defined as a region recording an air velocity that exceeds 1 ms−1 for a profile length of more than 500 m. Considering WPR measurement uncertainties, we have applied a stringent requirement of 1.5 ms−1 vertical velocities for the core detection, which is similar to those in previous profiler studies of May and Rajopadhyaya 1999) and Giangrande et al. (2013). Each individual vertical velocity profile is checked for the downdrafts and updrafts with minimum vertical length of 500 m. If this vertical length is shortened, the core detection could be influenced by the turbulent fluctuations. The duration of updraft/downdraft cores was estimated based upon the number of consecutive WPR profiles with updraft/downdraft cores exceeding the velocity threshold. Following Giangrande et al. (2013) the core diameter length is defined as the product of wind speed and the duration of the designated core observation. The vertical velocity retrievals corresponding to the range bins with SNR below−22 dB were discarded. During the dryline event the maximum vertical velocity was observed to be mostly below ±10 ms−1. The maximum upward vertical velocity at the leading edge of a density current is commonly 10 ms−1 (Reif et al., 2020).
4.3 Slab model based atmospheric boundary layer height evolution
To develop an insight into the factors governing the ABL evolution during the dryline event we considered two slab models and utilized the available measurements near the ground surface and in the proximity of the ABL top. The details of the models and the estimation of ABL height are summarized as follows:
4.3.1 Encroachment model
In this model the ABL height (h) is computed by considering the dynamic entrainment due to turbulence at the ABL top
The ABL height was computed by integrating Eq. (1) from 0630 to 1,600 Hours (Local time), with the ABL height estimated from the WPR at 0630 Hours as the initial condition. Also, the surface kinematic flux derived from eddy-covariance measurements at the 30-min time step, and potential temperature gradient from MWRP measurements was incorporated. For the slab models, the entrainment flux is usually assumed to be proportional to sensible heat flux at the surface by
4.3.2 The B&G model
With encroachment model equation above as the base model, Gryning and Batchvarova (Gryning and Batchvarova, 1990; Batchvarova and Gryning, 1991; hereafter B&G) developed a parameterization for the heat flux at the ABL top which takes into account the kinetic energy consumption near the inversion, the vertical convection and additional mixing due to velocity shear in the ABL. This is incorporated into the Encroachment model by replacing the ABL height with the corrected ABL height as follows:
where A (Entrainment coefficient), B, and C are parameterization constants equal to 0.2, 2.5 and 8, respectively, k is von Karman constant (0.4), g is the acceleration due to gravity (9.8 ms−2), u* is friction velocity, L is Obukhov length. The values of u* and L were incorporated from the micrometeorological tower measurements.
5 Results
The spatio-temporal evolution of drying in the atmospheric column could be noted in Figure 1C with minimum precipitable water (MERRA-2 Model M2T1NXLND v5.12.4 product) on the east side of the WG and its extension inland, towards east. The eastern region is characterized by higher precipitable water due to advection of moisture from the Bay of Bengal (BoB). However, as may be noted, these moisture incursions are not very systematic. The dry tongs of less moisture intruding towards the east are noted in diurnal cycle during the pre-monsoon.
We considered a period of dryness from 28–30 May 2019 for this study (as marked with a dashed line in Figure 1C), considering the maximum drying over the rain shadow study region. Figure 2 indicates the monthly mean vertical profiles of total specific humidity tendency over the same region as depicted in Figure 1C. It may be clearly noted that the BoB and the Arabian Sea have the highest positive tendencies and there is an increase in the tendencies over the middle atmosphere. However, the rain shadow region has the driest lower atmosphere up to 750 hPa. The main source of low-level atmospheric moisture over the study region is the Arabian Sea, since the low-level moist air mass from the BoB is restricted to only 200 km along the east coast adjacent to BoB (Akter and Tsuboki, 2017). Interestingly, above the observational site (Marked by a dash line in Figure 2), a sandwich of moist and dry air masses is observed with low-level moist air mass reaching the site from the Arabian sea on the west, dry northwesterly air mass over the rain shadow region up to 750 hPa and moist upper-level air mass above 750 hPa from the BoB.
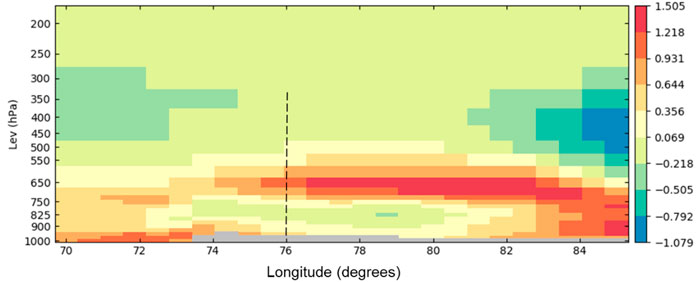
FIGURE 2. Vertical variation of monthly (May 2019) mean specific humidity tendency (kg kg−1 s−1) over the area (17–20.5°N) and (70–85.0°E). Vertical line indicates the study location.
Figure 3A depicts the SkewT plot with a very dry ABL and upper atmosphere with a lifting condensation level (LCL) close to 4 km at 1°C. The precipitable water is 2 cm and there is no convective available potential energy (CAPE). The winds are very weak throughout the layers and in the lower atmosphere up to 6 km; also we can discern weak north westerlies. Figure 3B indicates the spatial distribution of the water vapour mixing ratio (g kg-1) at 4 model levels at a 1 km difference starting at 1 km. The lower atmospheric convergence of moisture is noted over the west coast and further, only one-third of the moisture content is noted over the inland site. There are indications of a low-level moisture front in the WRF model, which propagates towards the east and reaches the site at 1600 UTC. Figure 4 illustrates the diurnal cycle of moisture propagation over the region at 1 and 3 km altitude levels on 29 May 2019 from 0700 to 1900 UTC. The diurnal cycle shows the propagation of low-level moisture front in the lower part of the boundary layer and strong gradients in moisture at 3 km. The interaction between the low-level warm, moist air mass on the south-west and upper-level hot, dry air mass on the north-west is clearly discerned with the hot, dry air mass pushing the warm, moist air mass to the south-west during the afternoon hours (1,000 and 1300 UTC). Further, we present a detailed investigation of the dryline event based on the ground based observations from Tuljapur and Solapur.
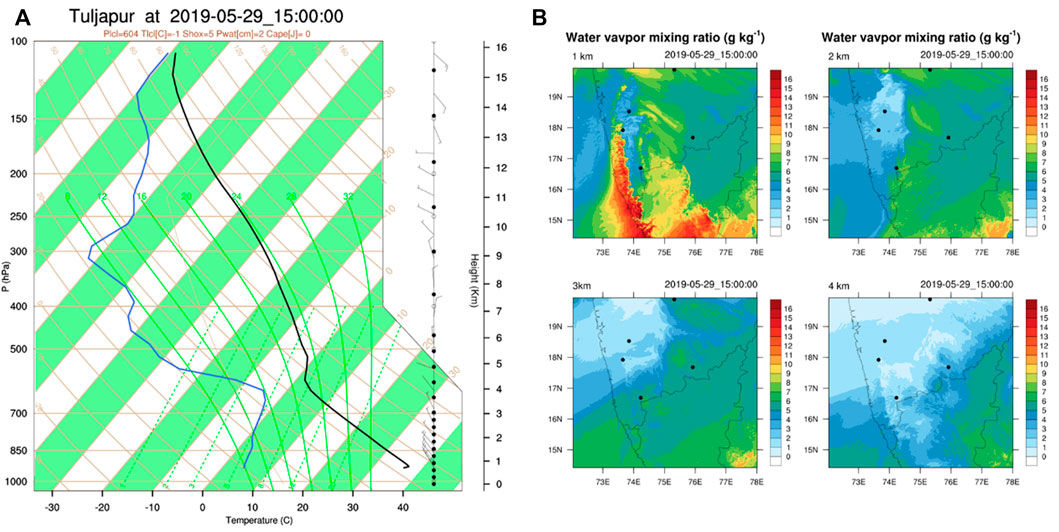
FIGURE 3. (A) SkewT from WRF model (blue line is dew point temperature, black line is dry bulb temperature, winds are shown with wind barbs) at Tuljapur on 29 May 2019 at 1500 UTC. (B) The spatial distribution of water vapour mixing ratio at four different altitudes.
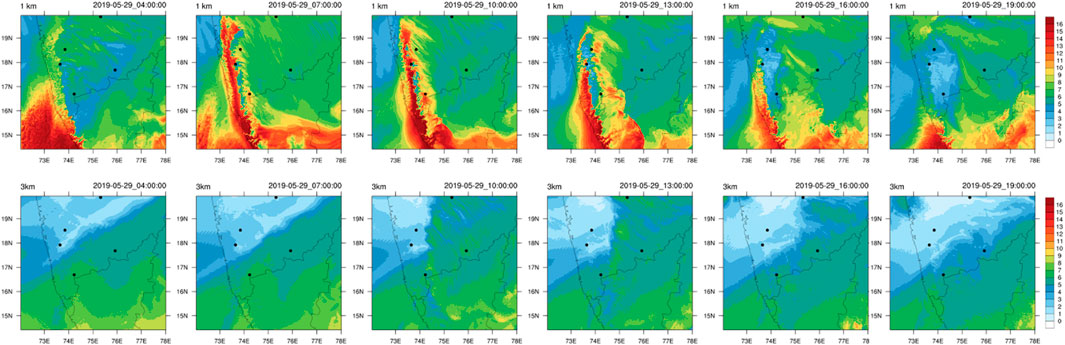
FIGURE 4. Diurnal cycle (0700–1900 UTC) of the spatial distribution of moisture from WRF model on 29 May 2019 at 1 km and 3 km altitude levels.
5.1 Thermodynamic conditions
Based upon the MWRP measurements the thermodynamic conditions of the ABL are assessed during the dryline event. The ABL height from MWRP is estimated from the parcel method. Very high ABL height is observed (up to 6 km) as depicted in Figure 5A. The reason for such high ABL height detection from MWRP has been investigated in more detail based upon contemporaneous measurements from WPR and micrometeorological tower. Overall, the argument is that the moist layer present at 4–5 km is disturbed by this mixing and entrainment during the ABL growth. The entrainment is happening even to greater altitudes above 5 km. During the nighttime, the ABL height detected by the MWRP is at 1 km and the standard deviation is slightly higher as compared with daytime ABL height variation. As the ABL grows, the LCL also grows and is noted at 4–4.5 km. Minimum LCL at 2.8 km is observed during the nighttime (which is approximately 1 km higher than the minimum LCL on 27 and 31 May 2019), thereby implying a lower atmospheric moisture content from 28 to 30 May 2019.
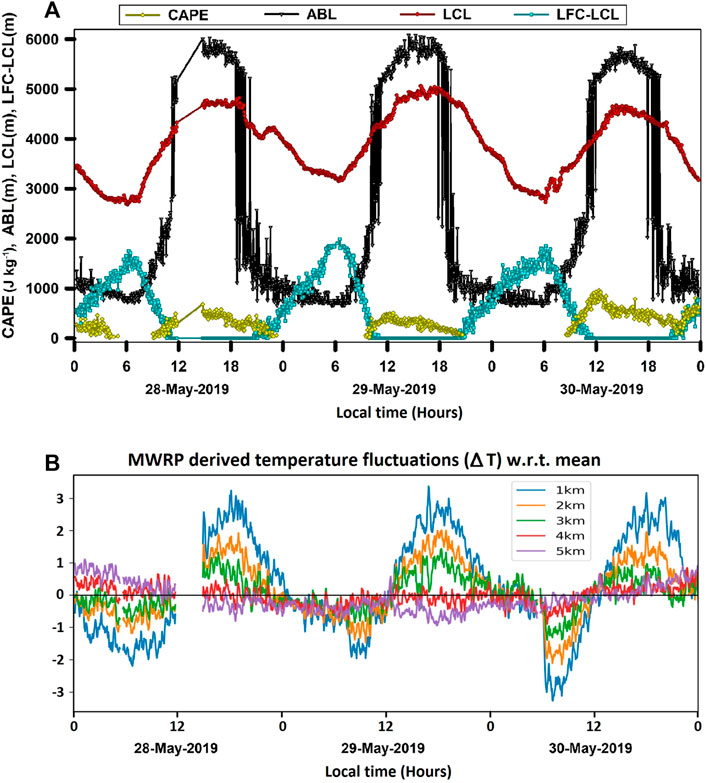
FIGURE 5. Temporal variation of MWRP derived parameters (A) LCL height, ABL height, LFC-LCL height, CAPE and (B) Temperature fluctuations observed during the period 28–30 May 2019. Temperature fluctuation are deviations from daily average.
The CAPE peaks only in the early morning and decreases during the day to a minimum as the atmosphere is fully dried. The height difference between the LCL and the level of free convection (LFC) is important when determining convection initiation. The smaller the difference between the LFC and the LCL, the more likely deep convection becomes, however the deep boundary layer and low cape does not favour the convection to occur in the current situation. All conditions from the radiometer observations clearly indicated that no clouds could form in these adverse conditions. Moreover, based on MWRP observations it was also noted that temperature deviations continued to show an increase in the lower atmosphere until midnight as depicted in Figure 5B, while the warming was noted throughout the 3 km depth. The unstable atmosphere prevailed later in the evening during the dryline event.
5.2 Atmospheric boundary layer diurnal cycle
To gain further insight into the impact of dryline event on ABL evolution we compared the WPR retrieval-based mean ABL heights during the dryline event with the mean ABL diurnal cycle during the normal period. As clear from Figure 6 the ABL evolves up to 4 km altitude on average during the first fifteen days of the month of May, whereas during the dryline event from 28 to 30 May the ABL evolves up to 5 km altitude. Sathyanadh et al. (2017) also found such deep ABL of up to 4 km during the pre-monsoon months over the central Indian and southern peninsular region based upon MERRA-2 PBLH dataset for the year 2011. In addition, the MERRA PBLH from 1 to 15 May 2019 over the study region was found to evolve up-to 3.8 km on average. However, the 1 km higher ABL during the dryline event could be the outcome of the stronger daytime ABL heating (higher sensible heat flux) towards the east (hot, dry air mass) as compared to the western side (warm, moist air mass). As the ABL grows rapidly over the eastern dry and hot side it further deepens due to the entrainment of the dry air from above. Figure 7 depicts the diurnal cycle of ABL during the dryline event on 28, 29, and 30 May 2019. As can be seen, the ABL evolution is relatively gradual until noon (1200 Hours), and then a very rapid deepening of the ABL is observed. The adjacent RTI plots depict the variation of 15-min mean horizontal winds. For the range bins with SNR below the threshold (−22 dB), the corresponding wind measurements were rejected for further analysis. As per the analysis of the WPR wind profiles, oscillatory nature of horizontal wind vector is observed between north westerly and northeasterly flow in the convective daytime hours. Below 1 km altitude, strong horizontal wind flow of up to 15 ms−1 was observed during the night-time and early morning hours (2000–0800 Hours). In contrast, during the convective hours (0900–1800 Hours) the wind flow was relatively weak (below 8 ms−1). The nocturnal periods are characterized by low-level jets of local origin as described in Prabha et al. (2011) with a very dry 2–4 km layer, while the convective thermals dominate during the daytime. Such low-level jets has also been associated with higher night-time turbulence, largely due to vertical wind shear and the appearance of horizontal convective rolls and coupled Kelvin-Helmholtz vortices in the residual layer (Grasmick and Geerts, 2020; Solanki et al., 2022).
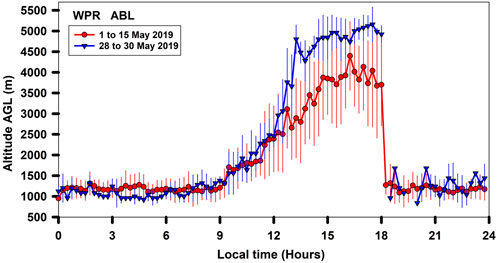
FIGURE 6. Estimated Atmospheric boundary layer height variation during dryline event from 28 to 30 May 2019 (blue line and triangles) and during 1–15 May 2019 (red line and triangles) based upon 15-min mean SNR profiles. Vertical bars indicate the standard deviations during the averaging period.
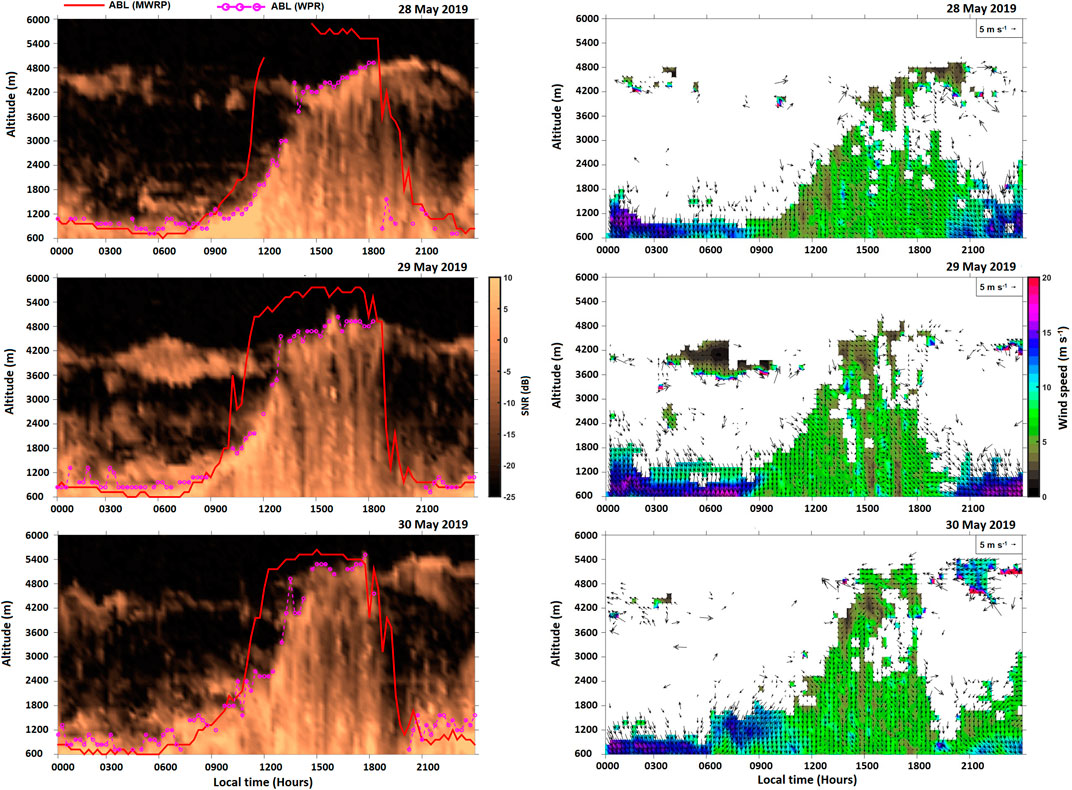
FIGURE 7. Estimated Atmospheric boundary layer height (dashed pink line) variation during 28–30 May 2019 estimated based upon 15-min mean SNR profiles (Left side panels). The adjacent panels on the right side depict the diurnal variation of the horizontal wind vectors.
Although surface heating is usually anticipated as the primary forcing for the deepening of the ABL, the extra deep ABL has been associated with strong thermodynamic land surface processes (Ma et al., 2011), near-neutral residual layer in connection with large-scale advection (Han et al., 2015), and heterogeneous surface albedo (Huang et al., 2010). Recently, Zhang et al. (2022) identified a distinctive boundary-layer process that entrains free-tropospheric air into the residual layer and subsequently, this warmer residual layer is entrained into the ABL, thus providing the extra energy for the ABL growth. Moreover, this unique process of entrainment heating was correlated with stronger downdrafts. In context with the above-mentioned articles, we investigate vertical velocity variation and henceforth the impact of entrainment on ABL growth during the dryline event based upon two slab models.
5.3 Vertical velocity variations
The vertical velocity variations along with the downdraft/updraft core characteristics during the dryline event from 28 to 30 May 2019 are depicted in Figure 8. The vertical velocities in the ABL are relatively stronger as compared to the nighttime hours. The strong updrafts and downdrafts are observed to scale the entire boundary layer during the evolution of the ABL from 0900 to 1800 hours. Although stronger updrafts are usually associated with ABL evolution, the number and duration of downdrafts were found to be higher during the dryline event over the site. This clearly suggests the significant contribution of free-tropospheric dry air entrainment into the ABL. Particularly, in case of weak stratification, the rapid downward entrainment of dry air could be associated with rapid boundary layer growth (Mahrt, 1976; Ansmann et al., 2010).
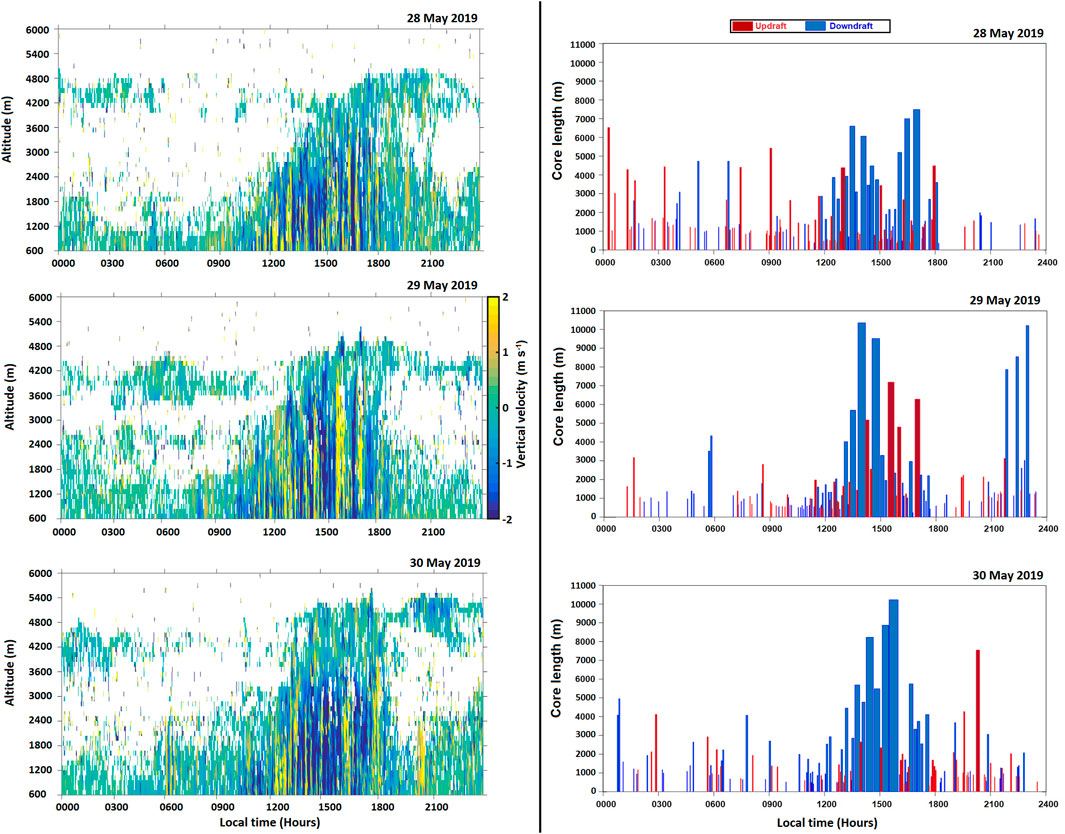
FIGURE 8. Instantaneous vertical velocity variation during 28–30 May 2019 (Left side panels). The adjacent panels on the right side depict the timing, duration (width) and core length (length) of updrafts (Red rectangles) and downdrafts (Blue rectangles).
On the basis of the WPR vertical velocity measurements the updraft and downdraft were identified. In total, approximately 204 downdraft cores and 168 updraft cores were observed during the three days dryline event. Longer downdrafts both in terms of spatial and temporal extent were observed as compared with updrafts. The duration of updraft and downdrafts has also been analyzed based upon the WPR vertical velocity retrievals.
In general, core lengths of up to 1,500 m are more prevalent with shorter updraft cores (<1,500 m) being more frequently observed while longer downdraft cores (>2,500 m) are slightly more common. However, longer updraft and downdraft cores were prominently observed in the afternoon hours with a core length of more than 4,000 m. Based on the analysis of the core median velocity histograms the stronger updrafts are found to be more frequent as the distribution of median velocity for updrafts was found to be less positively skewed.
5.4 Surface flux variations
The variations of sensible heat flux, latent heat flux and dew point temperature during 28–30 May 2019 are depicted in Figure 9. Large amplitude of diurnal variations is observed for the sensible heat flux while the latent heat flux undergoes relatively much smaller variation, remaining mostly below 100 W m-2 during daytime. The ratio to sensible and latent heat flux clearly reveals the arid conditions over the site in the afternoon hours (Bowen ratio of more than 6), which is further confirmed by the rapid decrease (more than 10 K) in the dew point temperature from 0900 Hours onwards (a similar decrease in specific humidity of up to 10 g kg−1 is also observed). The lowest dew point observed on 29 May further confirms the highly dry conditions over the site as depicted in the Hovmoller diagram (Figure 1C). Interestingly, a further increase and fluctuations are observed in sensible heat flux after 1,200 Hours on 28 and 29 May, which clearly corresponds to the further drying-up of the ABL due to the free-tropospheric entrainment of dry air into the ABL. After the sunset, the specific humidity starts to increase gradually implying the formation of nocturnal stable ABL.
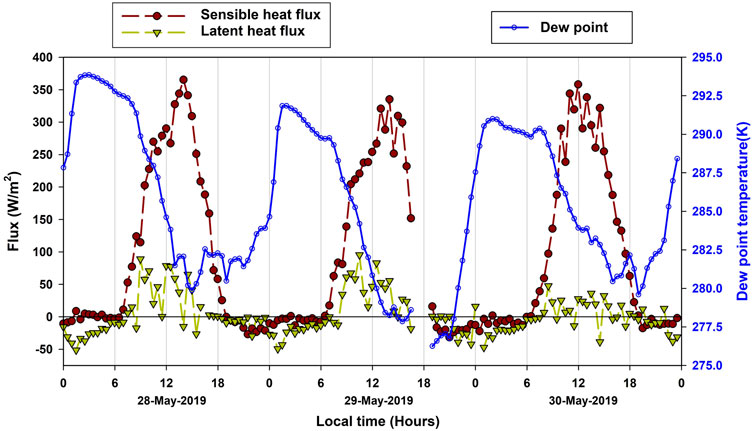
FIGURE 9. Variability of sensible heat flux, latent heat flux and dew point temperature at Solapur during 28–30 May 2019. The 30 min mean fluxes are based upon the fast response micrometeorological tower measurements.
5.5 Entrainment flux
Entrainment occurs by the engulfment of the dry free-tropospheric air near the overshooting thermals (Driedonks and Tennekes, 1984; Angevine, 1999; Brooks and Fowler, 2012). The wide range of timescales and space scales of the entrainment processes makes them difficult to measure or model accurately (Boers et al., 1984; Driedonks and Tennekes, 1984; Stull, 1988; Angevine, 1999). The entrainment velocity is the rate at which the air from the overlying free-troposphere is incorporated into the ABL. In this study, we utilized the WPR measurements for the retrieval of ABL height and vertical velocity (
The entrainment velocity determines the evolution of the ABL and the amount of free tropospheric air with different properties brought down into the ABL. Since relatively warmer air has to be brought down into the ABL at the expense of turbulent kinetic energy, the main counteracting influence on entrainment velocity is the step change in the potential temperature (Driedonks and Tennekes, 1984). The entrainment flux can be calculated as the product of entrainment velocity and the step change in potential temperature as originally described by Lilly (1968) assuming the absence of any mechanical contribution. By including the mechanical turbulence at the surface (Tennekes, 1973; Vilà-Guerau de Arellano et al., 2015) the entrainment coefficient is estimated as follows:
For this study, the dynamic entrainment coefficient (A) has been estimated based upon the ABL-top vertical velocity measurements from WPR; MWRP measurements to estimate the potential temperature difference between the surface and ABL top (
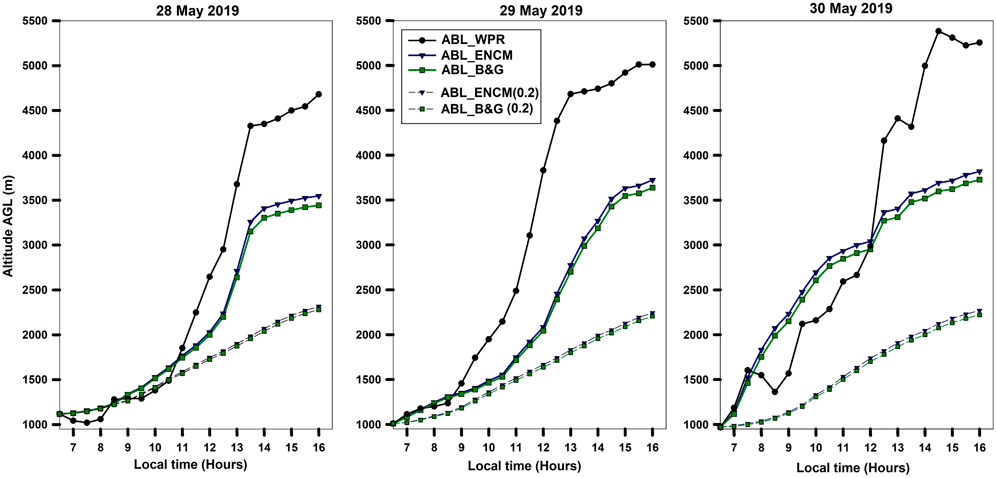
FIGURE 10. Comparison of half hourly estimates of ABL height on 28, 29, and 30 May 2019 between WPR retrieved ABL height and model estimates. The black circles represent WPR ABL retrievals; whereas the Blue triangles and Green squares represent ABL estimates based upon the Encroachment model and B&G model respectively. The blue and green dashed line (with triangle and squares) represent the model estimates of ABL evolution with constant entrainment coefficient of 0.2, while the blue and green solid lines (with blue triangles and green squares) are the model estimates of ABL evolution with dynamic entrainment coefficient based primarily upon WPR vertical velocity measurements.
These results clearly highlight the significance of strong free tropospheric entrainment which results in the further growth of the ABL during the dryline event. Overall the entrainment coefficient was found to vary between 0.2 and 6.0 during the dryline event over the site which is consistent with the findings of Sandeep et al. (2015) and Su et al. (2022). Sandeep et al. (2015) estimated entrainment flux based on wind profiler vertical velocity measurements (along with the 3 hourly radiosonde ascents and flux tower measurements) over a rural site during a 3-day campaign, with the entrainment coefficient varying between 0.5 and 1.1 during the morning and evening transitions when the sensible heat flux is weaker. Su et al. (2022) found that aerosol loading can significantly suppress the entrainment rate, breaking the conventional linear relationship between sensible heat fluxes and entrainment fluxes.
6 Discussion
Based on the WPR measurements the influence of dryline events on the ABL evolution was evaluated over the rain shadow region of the WG. The results were analyzed along with the combination of surface-layer fluxes and MWRP measurements. It was found that during the dryline event the ABL evolves by an additional 1 km, reaching up to 5 km altitude. The analysis of the vertical velocity measurements revealed the presence of stronger downdrafts thus highlighting the possibility of dry air entrainment into the ABL and its influence on rapid ABL growth during the afternoon. Based on the WPR vertical wind measurements, the entrainment flux was estimated and the dynamic values of the entrainment coefficient were incorporated into the ABL slab model along with the theoretical estimates of the entrainment coefficient. Significant improvements were noted in the model-based ABL evolution based upon a dynamic entrainment coefficient as compared to a constant entrainment coefficient. The ABL height estimated from slab models clearly implies the importance of stronger entrainment of dry air into the ABL during the dryline event. However, even with the dynamic entrainment coefficient the slab model based ABL maximum heights were at least 1 km lower than the WPR based ABL height retrievals, thus highlighting the need for further investigation of the other possible factors (such as advection due to terrain-induced dynamically driven flows) responsible for the deep ABL during the dryline event and the incorporation of such factors into the model calculations (Adler and Kalthoff 2016; Solanki et al., 2021). Understanding such dryline events will be very important in the warming climate along with the necessity for representation of such events in the numerical models.
Berg et al. (2021) indicated that entrainment is significant as the updraft fraction increases. This indeed indicates that the entrainment coefficient cannot be a constant and should be varying during the diurnal cycle. Our study states that the ABL depths could be better estimated through its growing stage, with higher entrainment rates from the free troposphere. Constraining the entrainment rates through a constant value may be inappropriate, especially for deciphering the ABL depth more accurately in these adverse conditions. The enhanced entrainment and the updraft fraction indeed indicate a feedback process induced by the entraining air parcels.
Data availability statement
The raw data supporting the conclusions of this article will be made available by the authors, without undue reservation.
Author contributions
TP conceptualized the article. TP and RS contributed in the background research and analysis of the measurements. TP and RS wrote the majority of the manuscript. TP, NM, and KG performed WRF analysis. JR contributed towards the data curation, data analysis and validation.
Funding
The CAIPEEX project is executed by the IITM, Pune and is funded by the Ministry of Earth Sciences (MoES), Government of India.
Acknowledgments
Contributions of several of our colleagues are greatly acknowledged, especially Subharthi Chowdhuri, Kiran Todekar and Imran Sayyed. We thank our colleague Mr. P Murugavel for the fruitful discussions on radar frequencies and their response to atmospheric phenomena. We are grateful to the Director, IITM for the kind support. IITM established the laboratories, as part of CAIPEEX, at Savitribai Phule Shikshan Prasarak Mandal’s N. B. Navale Sinhgad College of Engineering Solapur, Maharashtra, India and also at Sri Tulja Bhavani College of Engineering, Tuljapur, Maharashtra, India under Memorandum of Understandings (MoUs). Authors acknowledge the support received from these two Institutes. The Global Modeling and Assimilation Office (GMAO) and the GES DISC are acknowledged for the dissemination of MERRA data.
Conflict of interest
The authors declare that the research was conducted in the absence of any commercial or financial relationships that could be construed as a potential conflict of interest.
Publisher’s note
All claims expressed in this article are solely those of the authors and do not necessarily represent those of their affiliated organizations, or those of the publisher, the editors and the reviewers. Any product that may be evaluated in this article, or claim that may be made by its manufacturer, is not guaranteed or endorsed by the publisher.
References
Adler, B., and Kalthoff, N. (2016). The impact of upstream flow on the atmospheric boundary layer in a valley on a mountainous island. Bound. Layer. Meteorol. 158, 429–452. doi:10.1007/s10546-015-0092-y
Akter, N., and Tsuboki, K. (2017). Climatology of the premonsoon Indian dryline. Int. J. Climatol. 37, 3991–3998. doi:10.1002/joc.4968
Angevine, W. M., White, A. B., and Avery, S. K. (1994). Boundary-layer depth and entrainment zone characterization with a boundary-layer profiler. Bound. Layer. Meteorol. 68 (4), 375–385. doi:10.1007/bf00706797
Angevine, W. M. (1999). Entrainment results including advection and case studies from the Flatland boundary layer experiments. J. Geophys. Res. 104, 30947–30963. doi:10.1029/1999jd900930
Ansmann, A., Fruntke, J., and Engelmann, R. (2010). Updraft and downdraft characterization with Doppler lidar: cloud-free versus cumuli-topped mixed layer. Atmos. Chem. Phys. 10, 7845–7858. doi:10.5194/acp-10-7845-2010
Balaji, B., Prabha, T. V., Rao, J. Y., Todekar, K., Gurnale, D., Chakravarty, K., et al. (2017). Potential of collocated radiometer and wind profiler observations for monsoon studies. Atmos. Res. 194, 17–26. doi:10.1016/j.atmosres.2017.04.023
Batchvarova, E., and Gryning, S.-E. (1991). Applied model for the growth of the daytime mixed layer. Bound. Layer. Meteorol. 56 (3), 261–274. doi:10.1007/BF00120423
Berg, L. K., Liu, Y., Yang, B., Qian, Y., Krishnamurthy, R., Sheridan, L., et al. (2021). Time evolution and diurnal variability of the parametric sensitivity of turbine-height winds in the MYNN-EDMF parameterization. JGR. Atmos. 126, e2020JD034000. doi:10.1029/2020JD034000
Bianco, L., and Wilczak, J. M. (2002). Convective boundary layer depth: Improved measurement by Doppler radar wind profiler using fuzzy logic methods. J. Atmos. Ocean. Technol. 19 (1), 1745–1758. doi:10.1175/1520-0426(2002)019<1745:cbldim>2.0.co;2
Boers, R., Eloranta, E. W., and Coulter, R. L. (1984). Lidar observations of mixed layer dynamics: tests of parameterized entrainment models of mixed layer growth rate. J. Clim. Appl. Meteor. 23, 247–266. doi:10.1175/1520-0450(1984)023<0247:loomld>2.0.co;2
Brooks, I. M., and Fowler, A. M. (2012). An evaluation of boundary-layer depth, inversion and entrainment parameters by large-eddy simulation. Bound. Layer. Meteorol. 142, 245–263. doi:10.1007/s10546-011-9668-3
Brugger, P., Banerjee, T., De Roo, F., Kr¨oniger, K., Qubaja, R., Rohatyn, S., et al. (2018). Effect of surface heterogeneity on the boundary-layer height: a case study at a semi-arid forest. Bound. Layer. Meteorol. 169 (2), 233–250. doi:10.1007/s10546-018-0371-5
Campbell, P. C., Geerts, B., and Bergmaier, P. T. (2014). A dryline in southeast Wyoming. Part I: Multiscale analysis using observations and modeling on 22 June 2010. Mon. Weather Rev. 142, 268–289. doi:10.1175/MWR-D-13-00049.1
Carson, D. (1973). The development of a dry inversion-capped convectively unstable boundary layer. Q. J. R. Meteorol. Soc. 99 (421), 450–467. doi:10.1002/qj.49709942105
Chowdhuri, S., Todekar, K., Murugavel, P., Karipot, A., and Prabha, T. V. (2021). Unravelling the turbulent structures of temperature variations during a gust front event: a case study. Environ. Fluid Mech. (Dordr). 21, 263–281. doi:10.1007/s10652-020-09769-z
Cohn, S. A., and Angevine, W. M. (2000). Boundary layer height and entrainment zone thickness measured by lidars and wind-profiling radars. J. Appl. Meteor. 39 (8), 1233–1247. doi:10.1175/1520-0450(2000)039<1233:blhaez>2.0.co;2
Collaud-Coen, M. C., Praz, C., Haefele, A., Ruffieux, D., Kaufmann, P., and Calpini, B. (2014). Determination and climatology of the planetary boundary layer height above the Swiss plateau by in situ and remote sensing measurements as well as by the COSMO-2 model. Atmos. Chem. Phys. 14, 13205–13221. doi:10.5194/acp-14-13205-2014
Driedonks, A. G. M., and Tennekes, H. (1984). Entrainment effects in the well-mixed atmospheric boundary layer. Bound. Layer. Meteorol. 30 (1-4), 75–105. doi:10.1007/bf00121950
Gayatri, K., Sandeep, J., Murugavel, P., Chowdhuri, S., Konwar, M., Dinesh, G., et al. (2022). Evaluation of high-resolution WRF model forecasts and their use for cloud seeding decisions. J. Atmos. Sol. Terr. Phys. 228, 105825. doi:10.1016/j.jastp.2022.105825
Giangrande, S. E., Collis, S., Straka, J., Protat, A., Williams, C., and Krueger, S. (2013). A summary of convective-core vertical velocity properties using ARM UHF wind profilers in Oklahoma. J. Appl. Meteorol. Climatol. 52, 2278–2295. doi:10.1175/jamc-d-12-0185.1
Granados-Muñoz, M. J., Navas-Guzmán, F., Bravo-Aranda, J. A., Guerrero-Rascado, J. L., Lyamani, H., Fernandez-Galvez, J., et al. (2012). Automatic determination of the planetary boundary layer height using lidar: one-year analysis over southeastern Spain. J. Geophys. Res. 117, D18208. doi:10.1029/2012JD017524
Grasmick, C., and Geerts, B. (2020). Detailed dual-Doppler structure of Kelvin-Helmholtz waves from an airborne profiling radar over complex terrain. Part I: Dynamic structure. J. Atmos. Sci. 77, 1761–1782. doi:10.1175/JAS-D-19-0108.1
Gryning, S. E., and Batchvarova, E. (1990). Analytical model for the growth of the coastal internal boundary layer during onshore flow. Q. J. R. Meteorol. Soc. 116 (491), 187–203. doi:10.1002/qj.49711649108
Gunnell, Y. (1997). Relief and climate in South asia: the influence of the Western Ghats on the current climate pattern of peninsular India. Int. J. Climatol. 17, 1169–1182. doi:10.1002/(sici)1097-0088(199709)17:11<1169::aid-joc189>3.0.co;2-w
Han, B., Zhao, C., Lv, S., and Wang, X. (2015). A diagnostic analysis on the effect of the residual layer in convective boundary layer development near Mongolia using 20th century reanalysis data. Adv. Atmos. Sci. 32 (6), 807–820. doi:10.1007/s00376-014-4164-6
Helbig, M., Gerken, T., Beamesderfer, E. R., Baldocchi, D. D., Banerjee, T., Biraud, S. C., et al. (2021). Integrating continuous atmospheric boundary layer and tower-based flux measurements to advance understanding of land-atmosphere interactions. Agric. For. Meteorol. 307, 108509. doi:10.1016/j.agrformet.2021.108509
Holzworth, G. C. (1964). Estimates of mean maximum mixing depths in the contiguous United States. Mon. Weather Rev. 92, 235–242. doi:10.1175/1520-0493(1964)092<0235:eommmd>2.3.co;2
Holzworth, G. C. (1967). Mixing depths, wind speeds and air pollution potential for selected locations in the United States. J. Appl. Meteor. 6, 1039–1044. doi:10.1175/1520-0450(1967)006<1039:mdwsaa>2.0.co;2
Huang, Q., Marsham, J. H., Parker, D. J., Tian, W., and Grams, C. M. (2010). Simulations of the effects of surface heat flux anomalies on stratification, convective growth, and vertical transport within the Saharan boundary layer. J. Geophys. Res. 115 (D5), D05201. doi:10.1029/2009jd012689
Huang, J., Wang, T., Wang, W., Li, Z., and Yan, H. (2014). Climate effects of dust aerosols over East Asian arid and semiarid regions. J. Geophys. Res. Atmos. 119 (19), 11398–11416. doi:10.1002/2014jd021796
Juang, J. Y., Porporato, A., Stoy, P. C., Siqueira, M., S., Oishi, A., C., Detto, M., et al. (2007). Hydrologic and atmospheric controls on initiation of convective precipitation events. Water Resour. Res. 43 (W03421), 1–10. doi:10.1029/2006WR004954
Kaimal, J. C., and Finnigan, J. J. (1994). Atmospheric boundary layer flows: Their structure and measurement. New York: Oxford University Press.
Kaisti, M., Altti, M., and Poutanen, T. (2014). Uncertainty of radiometer calibration loads and its impact on radiometric measurements. IEEE Trans. Microw. Theory Tech. 62 (10), 2435–2446. doi:10.1109/tmtt.2014.2349873
Knight, C. G., Knight, S. H. E., Massey, N., Aina, T., Christensen, C., Frame, D. J., et al. (2007). Association of parameter, software and hardware variation with large-scale behavior across 57 000 climate models. Proc. Natl. Acad. Sci. U. S. A. 104, 12259–12264. doi:10.1073/pnas.0608144104
Kumar, S., Allan, R. P., Zwiers, F., Lawrence, D. M., and Dirmeyer, P. A. (2015). Revisiting trends in wetness and dryness in the presence of internal climate variability and water limitations over land. Geophys. Res. Lett. 42, 10, 867–910, 875. doi:10.1002/2015GL066858
Lange, D., Rocadenbosch, F., Tiana-Alsina, J., and Frasier, S. (2015). Atmospheric boundary-layer height estimation using a Kalman filter and a frequency-modulated continuous-wave radar. IEEE Trans. Geosci. Remote Sens. 53 (6), 3338–3349. doi:10.1109/tgrs.2014.2374233
LeMone, M. A., and Zipser, E. J. (1980). Cumulonimbus vertical velocity events in GATE. Part I: Diameter, intensity and mass flux. J. Atmos. Sci. 37, 2444–2457. doi:10.1175/1520-0469(1980)037<2444:cvveig>2.0.co;2
Lilly, D. K. (1968). Models of cloud-topped mixed layers under a strong inversion. Q. J. R. Meteorol. Soc. 94 (401), 292–309. doi:10.1002/qj.49709440106
Liu, Y., Li, Y., Huang, J., Zhu, Q., and Wang, S. (2020). Attribution of the Tibetan Plateau to northern drought. Natl. Sci. Rev. 7 (3), 489–492. doi:10.1093/nsr/nwz191
Liu, C., Huang, J., Tao, X., Deng, L., Fang, X., Liu, Y., et al. (2021). An observational study of the boundary-layer entrainment and impact of aerosol radiative effect under aerosol-polluted conditions. Atmos. Res. 250, 105348. doi:10.1016/j.atmosres.2020.105348
Ma, M., Pu, Z., Wang, S., and Zhang, Q. (2011). Characteristics and numerical simulations of extremely large atmospheric boundary-layer heights over an arid region in north-west China. Bound. Layer. Meteorol. 140 (1), 163–176. doi:10.1007/s10546-011-9608-2
Mahrt, L. (1976). Mixed layer moisture structure. Mon. Wea. Rev. 104, 1403–1407. doi:10.1175/1520-0493(1976)104<1403:mlms>2.0.co;2
Margulis, S. A., and Entekhabi, D. (2004). Boundary-layer entrainment estimation through assimilation of radiosonde and micrometeorological data into a mixed layer model. Bound. Layer. Meteorol. 110, 405–433. doi:10.1023/b:boun.0000007221.53446.46
Martin, C. L., Fitzjarrald, D., Garstang, M., Oliveira, A. P., Greco, S., and Browell, E. (1988). Structure and growth of the mixing layer over the Amazonian rain forest. J. Geophys. Res. 93, 1361–1375. doi:10.1029/jd093id02p01361
Prabha, T. V., Goswami, B. N., Murthy, B. S., and Kulkarni, J. R. (2011). Nocturnal Low-Level Jet and ‘atmospheric streams’ over the rain shadow region of Indian Western Ghats. Q. J. R. Meteorol. Soc. 137, 1273–1287. doi:10.1002/qj.818
Racette, P., and Lang, R. H. (2005). Radiometer design analysis based upon measurement uncertainty. Radio Sci. 40, RS5004. doi:10.1029/2004RS003132
Reif, D. W., Bluestein, H. B., Weckwerth, T. M., Wienhoff, Z. B., and Chasteen, M. B. (2020). Estimating the maximum vertical velocity at the leading edge of a density current. J. Atmos. Sci. 77, 3683–3700. doi:10.1175/JAS-D-20-0028.1
Rey-Sanchez, C., Wharton, S., Vilà-Guerau de Arellano, J., Paw U, K. T., Hemes, K. S., Fuentes, J. D., et al. (2021). Evaluation of atmospheric boundary layer height from wind profiling radar and slab models and its responses to seasonality of land cover, subsidence, and advection. Geophys. Res. Atmos. 126, e2020JD033775. doi:10.1029/2020JD033775
Sandeep, A., Rao, T. N., and Rao, S. V. B. (2015). A comprehensive investigation on afternoon transition of the atmospheric boundary layer over a tropical rural site. Atmos. Chem. Phys. 15, 7605–7617. doi:10.5194/acp-15-7605-2015
Sathyanadh, A., Prabhakaran, T., Patil, C., and Karipot, A. (2017). Planetary boundary layer height over the Indian subcontinent: variability and controls with respect to monsoon. Atmos. Res. 195, 44–61. doi:10.1016/j.atmosres.2017.05.010
Singh, N., Solanki, R., Ojha, N., Janssen, R. H. H., Pozzer, A., and Dhaka, S. K. (2016). Boundary layer evolution over the central Himalayas from radio wind profiler and model simulations. Atmos. Chem. Phys. 16, 10559–10572. doi:10.5194/acp-16-10559-2016
Solanki, R., Guo, J., Li, J., Singh, N., Guo, X., Han, Y., et al. (2021). Atmospheric boundary layer height variation over mountainous and urban sites in Beijing as derived from radar wind profiler measurements. Bound. Layer. Meteorol. 181, 125–144. doi:10.1007/s10546-021-00639-9
Solanki, R., Guo, J., Lv, Y., Zhang, J., Wu, J., Tong, B., et al. (2022). Elucidating the atmospheric boundary layer turbulence by combining UHF radar wind profiler and radiosonde measurements over urban area of Beijing. Urban Clim. 43, 101151. doi:10.1016/j.uclim.2022.101151
Srinivasulu, P., Yashodha, P., Jayaraman, A., Reddy, S. N., and Satyanarayana, S. (2011). Simplified active array L-band radar for atmospheric wind profiling: Initial results. J. Atmos. Ocean. Technol. 28, 1436–1447. doi:10.1175/jtech-d-11-00011.1
Strong, C., Fuentes, J. D., Garstang, M., and Betts, A. K. (2005). Daytime cycle of low-level clouds and the tropical convective boundary layer in Southwestern Amazonia. J. Appl. Meteorol. 44 (10), 1607–1619. doi:10.1175/JAM2266.1
Stull, R. B. (1988). An introduction to boundary-layer meteorology. Dordrecht: Kluwer Academic Publishers.
Su, T., Li, Z., Zheng, Y., Wu, T., Wu, H., and Guo, J. (2022). Aerosol-boundary layer interaction modulated entrainment process. npj Clim. Atmos. Sci. 5, 64. doi:10.1038/s41612-022-00283-1
Tennekes, H. (1973). A model for the dynamics of the inversion above a convective boundary layer. J. Atmos. Sci. 30, 558–567. doi:10.1175/1520-0469(1973)030<0558:amftdo>2.0.co;2
van Heerwaarden, C. C., Vilà-Guerau de Arellano, J., Moene, A. F., and Holtslag, A. A. M. (2009). Interactions between dry-air entrainment, surface evaporation and convective boundary-layer development. Q. J. R. Meteorol. Soc. 135 (642), 1277–1291. doi:10.1002/qj.431
Vickers, D., and Mahrt, L. (1997). Quality control and flux sampling problems for tower and aircraft data. J. Atmos. Ocean. Technol. 14, 512–526. doi:10.1175/1520-0426(1997)014<0512:qcafsp>2.0.co;2
Vilà-Guerau de Arellano, J., van Heerwaarden, C. C., van Stratum, B. J. H., and van den Dries, C. L. A. M. (2015). Atmospheric boundary layer, integrating air chemistry and land interactions. New York, NY: Cambridge University Press. doi:10.1017/CBO9781316117422
Wang, M., Xu, X., Xu, H., Lenschow, D. H., Zhou, M., Zhang, J., et al. (2019). Features of the deep atmospheric boundary layer over the Taklimakan Desert in the summertime and its influence on regional circulation. JGR. Atmos. 124 (23), 12755–12772. doi:10.1029/2019jd030714
Weckwerth, T. M., and Parsons, D. B. (2006). A review of convection initiation and motivation for IHOP_2002. Mon. Weather Rev. 134, 5–22. doi:10.1175/mwr3067.1
Weston, K. J. (1972). The dry-line of northern India and its role in cumulonimbus convection. Q. J. R. Meteorol. Soc. 98, 519–531. doi:10.1002/qj.49709841704
Westwater, E. (2011). Microwave and millimeter-wave radiometric studies of temperature, water vapor and clouds. United States: N. p. doi:10.2172/1015232
White, A. B., Fairall, C. W., and Thomson, D. W. (1991). Radar observations of humidity variability in and above the marine atmospheric boundary layer. J. Atmos. Ocean. Tech. 8 (5), 639–658. doi:10.1175/1520-0426(1991)008<0639:ROOHVI>2.0.CO;2
Wyngaard, J. C., and LeMone, M. A. (1980). Behavior of the refractive index structure parameter in the entraining convective boundary layer. J. Atmos. Sci. 37, 1573–1585. doi:10.1175/1520-0469(1980)037<1573:botris>2.0.co;2
Zhang, L., Zhang, H., Li, Q., Wei, W., Cai, X., Song, Y., et al. (2022). Turbulent mechanisms for the deep convective boundary layer in the taklimakan desert. Geophys. Res. Lett. 49. doi:10.1029/2022GL099447
Ziegler, C. L., and Rasmussen, E. N. (1998). The initiation of moist convection at the dryline: Forecasting issues from a case study perspective. Wea. Forecast. 13, 1106–1131. doi:10.1175/1520-0434(1998)013<1106:tiomca>2.0.co;2
Keywords: CAIPEEX, atmospheric boundary layer (ABL) height, dryline, entrainment, slab model, vertical wind, wind profiler radar (WPR)
Citation: Solanki R, Malap N, Gayatri K, Rao YJ and Prabhakaran T (2022) Characteristics of a pre-monsoon dryline atmospheric boundary layer over the rain shadow region: A case study. Front. Remote Sens. 3:1028587. doi: 10.3389/frsen.2022.1028587
Received: 26 August 2022; Accepted: 03 October 2022;
Published: 18 October 2022.
Edited by:
Sanjay Kumar Mehta, SRM Institute of Science and Technology, IndiaReviewed by:
Bing Lin, National Aeronautics and Space Administration, United StatesLei Liu, National University of Defense Technology, China
Copyright © 2022 Solanki, Malap, Gayatri, Rao and Prabhakaran. This is an open-access article distributed under the terms of the Creative Commons Attribution License (CC BY). The use, distribution or reproduction in other forums is permitted, provided the original author(s) and the copyright owner(s) are credited and that the original publication in this journal is cited, in accordance with accepted academic practice. No use, distribution or reproduction is permitted which does not comply with these terms.
*Correspondence: Raman Solanki, raman.solanki@tropmet.res.in
†ORCID: Thara Prabhakaran, https://orcid.org/0000-0002-5240-2859