Deep attentive fusion network for flood detection on uni-temporal Sentinel-1 data
 Ritu Yadav
 Andrea Nascetti
  Yifang Ban
 - Division of Geoinformatics, KTH Royal Institute of Technology, Stockholm, Sweden
Floods are occurring across the globe, and due to climate change, flood events are expected to increase in the coming years. Current situations urge more focus on efficient monitoring of floods and detecting impacted areas. In this study, we propose two segmentation networks for flood detection on uni-temporal Sentinel-1 Synthetic Aperture Radar data. The first network is “Attentive U-Net”. It takes VV, VH, and the ratio VV/VH as input. The network uses spatial and channel-wise attention to enhance feature maps which help in learning better segmentation. “Attentive U-Net” yields 67% Intersection Over Union (IoU) on the Sen1Floods11 dataset, which is 3% better than the benchmark IoU. The second proposed network is a dual-stream “Fusion network”, where we fuse global low-resolution elevation data and permanent water masks with Sentinel-1 (VV, VH) data. Compared to the previous benchmark on the Sen1Floods11 dataset, our fusion network gave a 4.5% better IoU score. Quantitatively, the performance improvement of both proposed methods is considerable. The quantitative comparison with the benchmark method demonstrates the potential of our proposed flood detection networks. The results are further validated by qualitative analysis, in which we demonstrate that the addition of a low-resolution elevation and a permanent water mask enhances the flood detection results. Through ablation experiments and analysis we also demonstrate the effectiveness of various design choices in proposed networks. Our code is available on Github at https://github.com/RituYadav92/UNI_TEMP_FLOOD_DETECTION for reuse.
1 Introduction
According to a report by the Center for Research on the Epidemiology of Disasters (CRED, UClouvain) (UNDRR, 2015), floods were among the most destructive disaster events between 1995 and 2015. Another CRED report (CRED, 2021) states that in 2020, 23% more floods were recorded than the annual average of 163 events and 18% more flood deaths than the annual average of 5,233 deaths. With the extreme climate changes, floods are hitting harder than ever. The increased frequency and impact of floods affect not only developing countries but also developed countries around the world. Floods are causing large-scale damage to life, property, and the economy of billions of dollars. Robust and real-time flood detection can help to provide quick and reliable aid to affected lives. Also, for faster deployment of rescue missions, it is crucial to have situational awareness on the ground. Due to the impacted transport system, inspection from the ground can be dangerous as well as too slow. In such scenarios, satellites can help to map large geographical areas on time.
Synthetic Aperture Radar (SAR) imagery is routinely used to determine the extent of floods and other products derived. Compared to optical data such as Sentinel-2 imagery, SAR satellites data is the preferred tool for flood mapping due to their capability of capturing images day/night, irrespective of the weather conditions (Anusha and Bharathi, 2020). SAR systems operate in the microwave band, which are long wavelengths and have the capability to penetrate through clouds, to some degree of vegetation, rain showers, fog, and snow. Additionaly, the frequent revisit of the Sentinel-1 satellite makes it a good candidate for flood monitoring.
2 Related work
SAR data from various satellites such as RADARSAT-1, TerraSAR-X, ENVISAT, COSMO-SkyMed (CSK), and many others were explored for studies of water detection and flood mapping, such as (Lu et al., 2015), (Chini et al., 2017), (García-Pintado et al., 2015). These studies used a wide variety of methods like basic pixel-wise image difference, hierarchical split-based distribution difference, hydrodynamic model adaptation, etc. The launch of Sentinel-1 in 2014, provided global-coverage free data at 10-m spatial resolution with a 6 days nominal revisit time. Thanks to the improved spatial and temporal resolution, researchers investigated the use of Sentinel-1 data for flood detection in several studies, such as (Twele et al., 2016) where the authors used fuzzy logic-based classification combined with the Height above nearest drainage (HAND) index, (Psomiadis, 2016), where image difference with threshold is applied on bitemporal data, (Martinis, 2017), where the authors used time series data and the frequency of low backscatter areas is used to differentiate between permanent water bodies and floods.
More recently, Deep Learning (DL) algorithms are playing a major role in the advancement of image processing tasks such as classification, segmentation, etc. Multiple studies explored Convolutional Neural Networks (CNN) for the flood mapping and monitoring task. In (Amitrano et al., 2018), the authors experimented with a support vector machine and small neural networks models to analyze multitemporal Sentinel-1 data. The authors assessed their approach in five flood events using reference maps produced by the Copernicus Emergency Management Service (EMS). Similarly, (Tavus et al., 2022), tested a CNN on multitemporal Sentinel-1 data over four flood events. In (Liu et al., 2017), the authors proposed a deep convolutional network to detect flooded areas on multitemporal SAR data from Radarsat-1 and ERS-2 satellites. They tested it on only two flood events in Canada and Switzerland. In (Asaro et al., 2021), the authors aimed to delineate floods from Sentinel-1 data using the U-Net (Ronneberger et al., 2015) model. The data set contains three flood events from Belgium, Italy, and the Netherlands with low-quality labels. (Jeon et al., 2021). study also used a standard U-Net model to detect river floods using Sentinel-1 data. (Nemni et al., 2020). experimented with both U-Net and X-Net (Bullock et al., 2019) on UNOSAT Flood Dataset (Unitar, 2020). The dataset contains only VV polarization of Sentinel-1 data and covers floods from eight countries. Their results highlighted that the U-Net model performed better. In (Garg et al., 2021), authors proposed an ensemble of U-Net and U-Net++ models for flood detection. The NASA-ECTI dataset used in this study contains Sentinel-1 data on four flood events. The authors also experimented with DeepLab and U-Net architectures with multiple backbones. The best results were obtained using U-Net with the MobileNetv2 backbone.
Optical satellites such as Worldview and Sentinel-2 further boosted the usage of DL on satellite data. Optical data is generally unsuitable for capturing flooded areas due to high cloud coverage. However, there are multiple flood detection studies that use optical data such as (Moumtzidou et al., 2020), (Mateo-Garcia et al., 2021), (Peng et al., 2019), and many others. (Moumtzidou et al., 2020). tested VGG and ResNet-50 models on multi-temporal Sentinel-2 data from 335 flood events. (Mateo-Garcia et al., 2021). study compared flood detection capability of U-Net and SCNN on Sentinel-2 data. The U-Net performed better compared to SCNN. The WorldFloods dataset used (Mateo-Garcia et al., 2021) in this study covers 119 flood events that occurred between November 2015 and March 2019. (Peng et al., 2019). proposed a Siamese neural network ResPSNet for detecting floods on very high-resolution optical images. The model used is a change detection network that operates on bi-temporal data. The problem with the aforementioned Sentinel-2 dataset is that they suffer from a high percentage of cloud cover and have associated cloud shadow problems. These problems persist even after cloud and shadow masking. Also unlike Sentinel-1, the collected images are not close to flooding time or during the flood because the optical images during that time are majorly cloudy and not much of use.
All the above-mentioned DL studies were conducted on a small dataset with few sites or the quality of the data/labels is not good. For efficient training and better generalization, DL algorithms require quality data with a large amount of coverage. Also, the quality of labels is crucial if the algorithm is a supervised one. For a long time, there was no good quality global dataset for flood detection tasks. Recently, Sen1Floods11 (Bonafilia et al., 2020) has been released providing a global uni-temporal flood detection dataset with Sentinel-2 optical and Sentinel-1 SAR images. Moreover, the ground truth provided by the dataset is manually verified by the experts. The Sentinel-2 images in the dataset are partly cloudy in most of the cases but the dataset is large and covers different terrain. The availability of a large representative data set allowed us to explore the potential of DL in flood detection tasks. This also helps in providing a solution that can be generalized to unknown sites.
The (Bonafilia et al., 2020) provided a baseline on the Sen1Flood11 dataset, where they tested a Fully Convolutional Neural Network (FCNN) on the Sentinel-1 and Sentinel-2 datasets separately. Four recent studies (Akiva et al., 2021; Konapala et al., 2021), (Bai et al., 2021) and (Yadav et al., 2022) also experimented with the Sen1Floods11 dataset. (Akiva et al., 2021). study introduced a domain adaptation method to segment floods. A model is trained on multispectral images of Sen1Flood11 and the trained model is used to get inferences on high-resolution images. The proposed method is self-supervised and hence requires no labels. On the other hand, (Konapala et al., 2021), and (Bai et al., 2021) are fully supervised segmentation studies. In (Konapala et al., 2021) the authors experimented with a combination of Sentinel-1, Sentinel-2, and digital elevation data. They employed a standard U-Net segmentation network with 3 channel inputs. (Bai et al., 2021). combined Sentinel-1 and Sentinel-2 data. Authors did not compare the performance of the network separately on Sentinel-1 and Sentinel-2 with the performance on the fusion of the two. Instead, they directly presented the results on the fusion. The authors used a cascaded U-Net architecture (BASNet) for flood detection which resulted in better feature map refinement and most probably the actual reason of improved results. (Yadav et al., 2022). extended the Sen1Floods11 dataset by adding pre-flood Sentinel-1 images and proposed a dual stream siamese network. Here the authors perform a change detection task to detect floods and achieved better results.
Sen1Flood11 contains Sentinel-1 and Sentinel-2 data. But Sentinel-2 is sensitive to weather conditions. Especially during floods, it is often the case that a considerable amount of the view is blocked by the clouds. Also algorithms confuse cloud shadows with water. This problem is also highlighted in the baseline evaluation of the Sen1Flood11 dataset. On the other hand, Sentinel-1 suffers from speckle noise but is not sensitive to clouds and provides cloud-free data over all areas. Speckle noise in Sentinel-1 data can be learned (to some extent) by a DL network but having no information on big parts of the flooded area makes Sentinel-2 less reliable for the task. Therefore we focused on developing a robust flood detection model on Sentinel-1 data.
Flood detection can be performed on uni-temporal as well as multi-temporal data. In comparison to multi-temporal, uni-temporal segmentation can sometimes be slightly less accurate but is faster and lighter on memory. This time and space efficiency makes uni-temporal segmentation an adequate option for fast onboard processing, enabling a near-real-time flood detection and alert system. The automatically segmentation maps generated on the satellites can be sent to ground stations through the downlink connection. On the basis of the segmentation maps generated on the satellites the flood extension can be quantified. If the flood extension is greater than a certain decided threshold, the downlink can be prioritized and flood warnings can be sent in a timely manner.
In this work, we proposed two segmentation models for flood detection on uni-temporal Sentinel-1 data. The first one is “Attentive U-Net”which uses VV, VH and ratio (VV/VH) channels as input. Depending on the flood site, environmental condition, and terrain morphology, one polarization (e.g., VV) is more important than the other (VH) to highlight the flooded area. Considering the different backscatter behaviors of VV and VH, we propose a self-attentive mechanism to capture the prioritization of channels over a large number of sites. A second model, the “Fusion Network”, is proposed to enhance the first “Attentive U-Net” model using local physical features of the area which give more context to the network. “Fusion Network” fuse Sentinel-1, DEM, and permanent water mask data. An overview of the architecture of the two proposed models is shown in Figures 3, 4, and more details are provided in Section 4.
3 Dataset
Our proposed networks are trained and evaluated on Sentinel-1 data from the Sen1Floods11 dataset (Bonafilia et al., 2020). The dataset contains 446 non-overlapped tiles from Sentinel-1 and Sentinel-2. Each tile is of size 512 × 512 pixels. The dataset is recorded over 11 flood events recorded from 11 different countries across the globe namely Bolivia, Ghana, India, Mekong, Nigeria, Pakistan, Paraguay, Somalia, Spain, Sri-Lanka and United States of America. All flood events were identified from a global database of flood events maintained by the Dartmouth Flood Observatory (Brakenridge, 2012). These flooded sites cover a wide variety of terrain morphologies, from flat areas to mountain regions. An overview of these sites is depicted in the global map; see Figure 1. The 11 flood events were selected considering the availability of Sentinel-1 and Sentinel-2 post-event imagery and minimizing the time gap between the two satellite acquisitions (image acquired on the same day or within max two days gap) to provide close-in-time observations of the flooded areas. Extensive cloud coverage during floods affects Sentinel-2 data, which in turn questions the reliability of the models developed on Sentinel-2 data. This problem is also highlighted in the baseline evaluation of the dataset. Since SAR is not sensitive towards clouds, we aim to explore the full potential of Sentinel-1 SAR data alone. The dataset contains orthorectified and radiometrically corrected Sentinel-1 SAR images at 10-m resolution, including the two bands for VV (vertical transmit, vertical receive) and VH (vertical transmit, horizontal receive) polarization. The dataset also provides global Permanent Water masks for flooded areas. These masks are sampled from the surface water dataset from JRC (European Commission Joint Research Center) (Pekel et al., 2016).
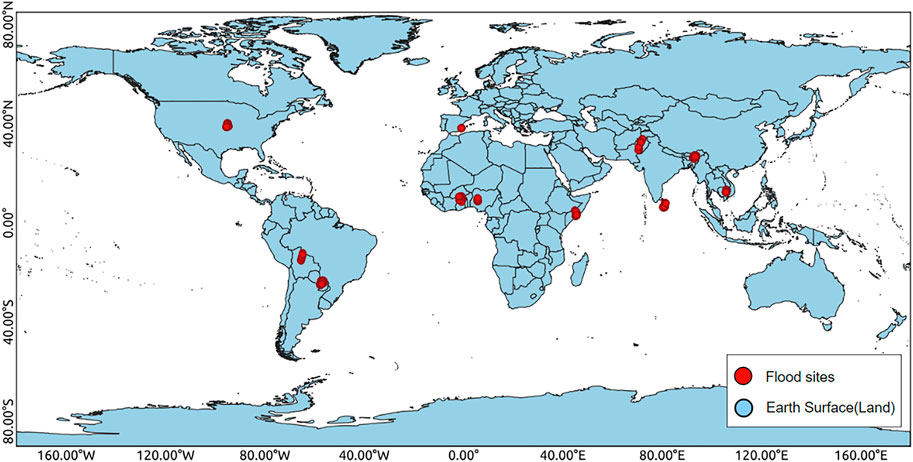
FIGURE 1. Data overview. The red dots represent the 11 flood sites. The data is captured in 446 tiles.
The dataset provides pixel-wise ground truth for all 11 sites. These ground truth masks are prepared after processing Sentinel-1 and Sentinel-2 separately and then combining and refining them with manual verification. First, a histogram is built on the Sentinel-1 VH band. Otsu thresholding was used in the histogram, which maximizes the inter-class variance between flooded and unflooded pixels. This threshold is then applied across a smoothed focal mean VH band to reduce speckle, resulting in a binary flood map. Second, Sentinel-2 imagery was processed by calculating Normalized Difference Vegetation Index (NDVI=(B8-B4)/(B8+B4), B = band) and Modified Normalized Difference Water Index (MNDWI= (B12-B3)/(B12+B3), B = band), followed by cloud removal, cloud shadow removal, and manual thresholding to obtain the binary flood map. Now, the information from the two flood maps is combined to prepare the final ground truth masks. The quality of the ground truth masks is ensured by hand labeling all 446 tiles and manual validation (Bonafilia et al., 2020). The ground truth mask has 0, 1, and −1 values, where 1 represents water, 0 is the absence of water, and −1 indicates missing data.
In addition to Sen1Floods11, we also used elevation data (i.e., DEM) from Shuttle Radar Topography Mission (SRTM). The DEM data is available in 30-m resolution. We upsampled it to 10-m resolution using bilinear interpolation. Theoretically, the interpolation procedure could introduce some artifacts and errors in the resampled DEM. However, the amount and magnitude of the interpolation artifacts are negligible for low-resolution DEM (GSD
We pre-processed Sentinel-1 dataset before feeding it to the proposed network. The VV backscatter values are clipped in the range (−23, 0) dB, and the VH in the range (−28, −5) dB. The clamped backscatters are considered as noise. Finally, the input data is channel-wise normalized i.e., depending on the network VV, VH, PW, DEM all input channels are normalized before feeding to the network. The training, validation, and test splits used in this work are following the Sen1Floods11 dataset guidelines provided by the authors (Bonafilia et al., 2020). Some of the data samples are visualized in Figure 2.
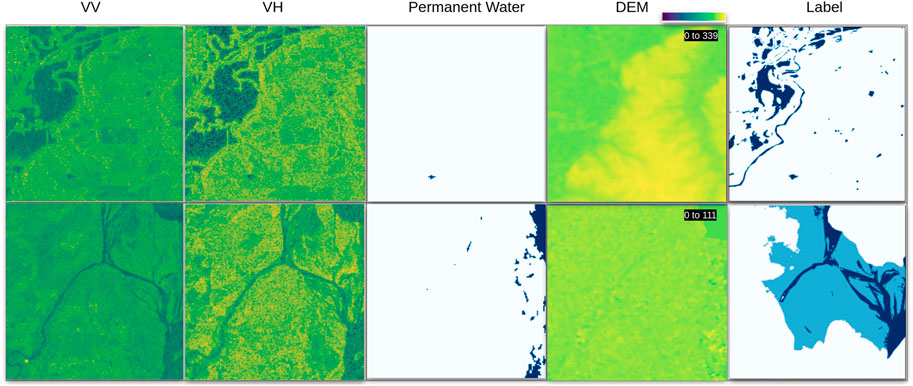
FIGURE 2. Sen1Floods11 data sample images. From left to right, VV, VH single channel SAR images, Permanent Water, Digital Elevation Model (DEM) and ground truth are visualized. Elevation range of each sample is shown in top right corner of the DEM visualization. The first row has 0, 1 and second row has −1, 0, 1 label values. The colors used for the values −1, 0, 1 are white, sky blue, and dark blue, respectively.
4 Proposed method
In this work, we propose two network architectures for flood detection, which are shown in Figure 3 and Figure 4. The first network Figure 3 operates on Sentinel-1 data. Whereas, the second network 4 utilize global elevation data (DEM) and permanent water (PW) masks as additional inputs. Both networks are designed for binary segmentation task. Therefore the output is a binary map with two classes “Flood” represented by value 1 and “Background” represented by value 0.
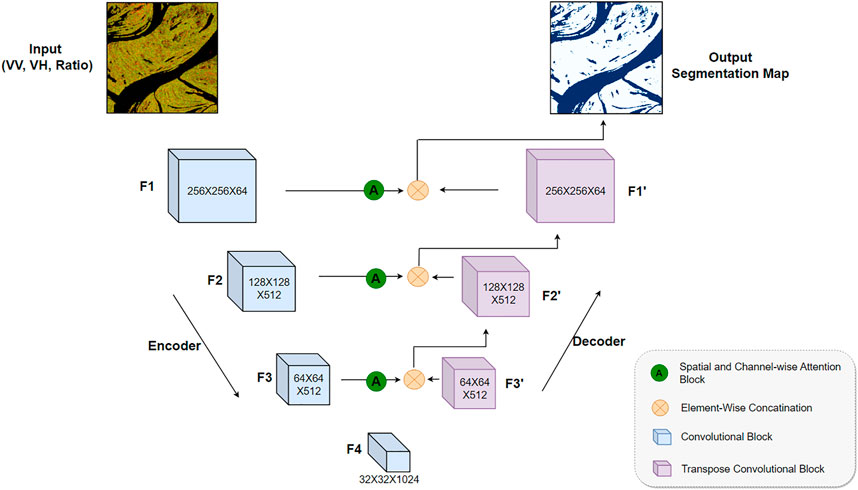
FIGURE 3. Architecture of Attentive U-Net. The network takes 3-channel (VV, VH, VV/VH) input and generate a binary segmentation map as output.
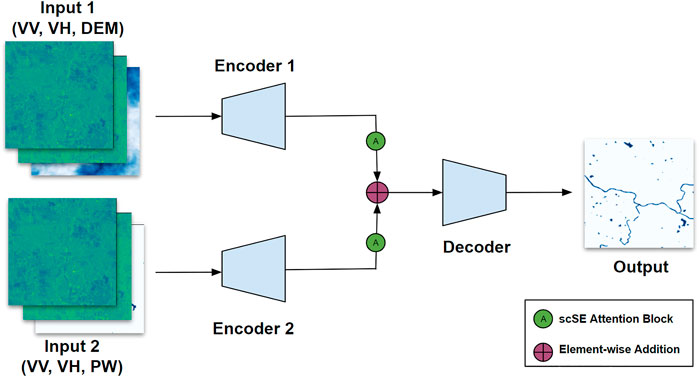
FIGURE 4. Fusion Network. Input1 is a 3-channel input with VV, VH, and DEM bands, Input2 is also a 3-channel input with VV, VH, and PW bands. The two encoders and decoder follow a similar architecture as that of ‘Attentive U-net’. The attentive output of the two encoders is fused using element-wise addition operations, and the output of the network is a binary segmentation map.
4.1 Attentive U-Net
U-Net is an encoder-decoder architecture that is generally used for segmentation tasks across various domains. The encoder consists of a stack of convolutional, pooling, and normalization layers that process the given input and brings it down to a smaller encoded representation. The decoder then processes and upsamples the output of the encoder back to its original size. The decoder network consists of transposed convolutional layers for upsampling. The output of the decoder is a segmentation map. Generally, the input consists of three channels, and the segmentation map is a 2D map, where each pixel represents the corresponding class. In the U-Net architecture, Feature maps from the encoder are concatenated with the up-sampled feature maps from the decoder. The concatenated output is then processed using convolutional and normalization operations. These connections between the encoder and decoder are called skip connections. U-Net uses skip connections to add fine-grained shallow features of the encoder to the decoder’s coarse-grained deep features for precise localization.
There are multiple existing works on SAR data which explore U-Net architecture for flood detection. These studies used VV and VH channels as input along with some information (DEM, Permanent Water, or sometimes empty) in the third channel. We propose to use the ratio (VV/VH) as the third channel as it provides important features for flood detection (Tsyganskaya et al., 2018). U-Net architecture learn features from all the input channels uniformly. But due to differences in the geographical area covered in the dataset, VV and VH backscatter behavior is not uniform. It is often observed that in a large number of samples, the flooded area is visible dominantly in one of the channels (VV, VH, ratio) and missing in others. So, the channel that contains more useful information for identifying flooded areas should receive more attention in comparison to others. Since the criteria for a more important channel is not straightforward, we propose an attentive U-Net where we let our deep CNN learn the prioritization of channels using channel-wise self attention.The architecture of our proposed network is shown in Figure 3. The input to the network is composed of 3 channels, the first 2 channels contains VV and VH backscatter. Since the ratio (VV/VH) provides important features for flood detection (Tsyganskaya et al., 2018), we used the ratio as the third input channel. Apart from getting important features from the ratio, using 3 channel input enables us to utilize ImageNet pre-trained weights in the encoder network. This helps in faster and better convergence of the model.
The encoder network encodes input in four stages named as F1, F2, F3, and F4 feature levels. We used residual (He et al., 2016) learning in encoder network to avoid any performance degradation issues. This is implemented as first four levels of Resnet-50 architecture. The output of each four feature levels is the source of input to the decoder.
The aforementioned attention mechanism is implemented using channel-wise attention which self-learns to prioritize certain channels over others based on the training data. In addition to this, we also added spatial attention to the network, which focus on enhancing the spatial features. Both channel-wise and spatial attention is applied as a module using Concurrent Spatial and Channel ‘Squeeze & Excitation’ (scSE) blocks (Roy et al., 2018). The scSE block helps to boost the good features and suppress the weak ones. The attention block gives greater weight to important spatial features and significant channels of the input. The scSE blocks are applied to the encoder output feature maps, as shown in Figure 3. The resulting attentive feature maps are then concatenated with the decoder feature maps F1’, F2’, and F3’.
The decoder network processes the input (F4) from encoder and upsampled to F3’, which is then concatenated with the attentive feature map from F3. The concatenated output is then upsampled to F2’. The same is implemented for F1’. The output of the network is a binary segmentation map, which contains one channel with height and width same as that of the input.
4.2 Fusion network
Fusion network is proposed to enhance the flood detection capability of CNN by using local physical features of the area which give more context to the network. In this network, we fuse Sentinel-1 data from the Sen1Floods11 dataset with global elevation data (SRTM DEM) and permanent water masks (PW). With additional DEM information, the network learns to derive a relation between the flooded regions (from VV, VH) and the elevation of those regions. By adding PW masks, we ensure that the network does not lose permanent water bodies from detection and that more attention is given to the area around the PW regions. We fuse elevation (DEM) with Sentinel-1 in one branch and permanent water mask with Sentinel-1 in the second. We fuse them in a separate branch (encoders) so that the model learns the relation of the elevation and permanent water features separately with Sentinel-1 data. After convolutional operations and self-attention, the features from the two branches are fused and fed to the decoder network. The model learns the features from end-to-end training.
An overview of our proposed fusion network is depicted in Figure 4. It consists of two streams with three channel inputs. The first stream’s input is composed of VV, VH, and DEM, whereas the second stream’s input is VV, VH, and PW mask. The two streams process inputs through “Encoder1” and “Encoder2”. The architecture of the two encoders is same as that of “Attentive U-net”. Hence, each encoder network contains four feature levels. The feature maps from the four feature levels are enhanced by spatial and channel-wise self attention. This is implemented by the scSE attention blocks. The attentive features from the two encoder networks are fused using an element-wise addition operation. The feature fusion takes place at all four levels. The resulting feature maps are the input to the decoder network, where the features are upsampled, concatenated, and processed to generate the output segmentation maps. The decoder of “Fusion Network” is also similar to the decoder of “Attentive U-net”.
4.3 Implementation and training
In this work, we detect the flooded areas by performing a binary segmentation task with two classes, “Flood” and “Background”. In the dataset, there is one extra class for invalid pixels labeled as −1. All invalid pixels (−1) are set to 0 in both the input and ground-truth images. The aim was to reduce the problem to binary segmentation and avoid unnecessary disturbance. We also masked out these invalid pixels from the predictions and ground truth during the evaluation process.
All experiments are carried out on the original image size 512 × 512. The encoders of both models take input of size 512 × 512 × 3, and the output size of the model is 512 × 512. All the training inputs are augmented using horizontal and vertical flips. The encoder networks of both architectures are initialized with the ImageNet pre-trained ResNet-50 weights He et al. (2016).
The models are trained with a weighted combination of dice loss (Sudre et al., 2017) and focal (Lin et al., 2017). The dice loss addresses the problem of data imbalance in the training data i.e., one (Background) class has more data in comparison to the other (Flood). The focal loss targets the imbalance between easy and hard training examples. The below Equation represents the weighted loss where the value of alpha is 0.2. We experimented with multiple alpha values. The best results were obtained with 0.2 weights for dice loss and 0.8 for focal loss.
We start the training with a learning rate of 5 ∗ 10–4. For better convergence, the learning rate decayed to 0.00001. The decay rate is controlled with the “reduce on plateau” method, which decays the rate by 1/10th when the learning curve is steady at a plateau. We choose the “adam” optimizer for network training. These hyperparameter settings were applied for all experiments. Both networks are trained for 70 epochs. If the learning (loss value) stagnates and the learning rate reaches 0.00001, the training automatically stops before 70 epochs. Since we are using large patches for training, the batch size is kept low and set to two. Both networks were trained on one Google Colab GPU. The proposed networks are implemented from scratch using python and TensorFlow.
4.4 Evaluation metric
Our network generate output as pixel-level binary change map. Therefore, the results are evaluated using pixel-level metrics. We used two metrics namely Intersection over Union (IoU) and F1-Score. Eqs 2–4 represents the IoU and F1 score formula, where True Positive (TP) represents flood pixels that are correctly classified as water; False Positive (FP) represents non-flood pixels that are incorrectly classified as a flood; True Negative (TN) represents non-flood pixels that are correctly classified as non-flood areas, and False Negative (FN) represents flood pixels that are incorrectly classified as non-flood.
4.5 Compared methods
We have selected the more relevant deep learning segmentation based methods to compare their performances with our two architectures. The results of our proposed uni-temporal flood detection networks are compared with (Bonafilia et al., 2020), FC-Siam-conc (Caye Daudt et al., 2018), (Konapala et al., 2021), (Qin et al., 2020), (Bai et al., 2021), (Yadav et al., 2022), (Akiva et al., 2021) and (Florian and Adam, 2017).
1. FCNN (Bonafilia et al., 2020) is the baseline provided by the authors of Sen1Floods11. A fully convolutional neural network with a ResNet-50 encoder was used to segment floods in this work. The network was experimented on both Sentinel-1 and Sentinel-2 data separately. We compare with the results on Sentinel-1 data.
2. U-Net (Konapala et al., 2021) used a standard U-Net for the flood detection task. Experiments were conducted with Sentinel-1 alone and different combinations of Sentinel-1, DEM and Sentinel-2 data. Since we are exploring SAR data, we kept our comparison fair and related. Therefore, we only compare with the U-Net results on Sentinel-1 data and on a combination of Sentinel-1 with DEM.
3. FC-Siam-conc (Caye Daudt et al., 2018) is a fully convolutional network with two input stream sharing weights (siamese). The network can be used for fusion (Cen and Jung, 2018). We used FC-Siam-conc (Caye Daudt et al., 2018) to fuse the inputs same as that of ‘Fusion Network’. The performance of the output segmentation network is compared with others.
4. BASNet (Bai et al., 2021) proposed to use fuse Sentinel-1 SAR and Sentinel-2 multispectral data. The data is fused before feeding into the network (early fusion). Since there is resolution difference between the two data, they are first resampled to match the spatial resolution and then fused by pixel-wise addition followed by normalization. The model used in the experiment is a cascaded U-Net called BASNet (Qin et al., 2019).
5. Additionally, we compared our results with two more segmentation models U2Net (Qin et al., 2020) and DeepLabv3 (Florian and Adam, 2017). U2Net is a cascaded U-Net model proposed for refined segmentation. DeepLabv3 network has large number of layers (i.e., depth), sparse feature learning capability and cascaded modules. It is more recent segmentation network with remarkable performance in computer vision. Therefore we tested U2Net and DeepLabv3 on remote sensing data and compared the results with ours. Both networks are tested on Sentinel-1 and DEM inputs i.e., VV/VH/DEM 3-channel input.
5 Results
5.1 Quantitative results
Our two proposed methods evaluated on the test set of Sen1Floods11 and compared with the existing methods. The quantitative comparison in terms of “IoU” and “F1-Score” is given in Table 1.
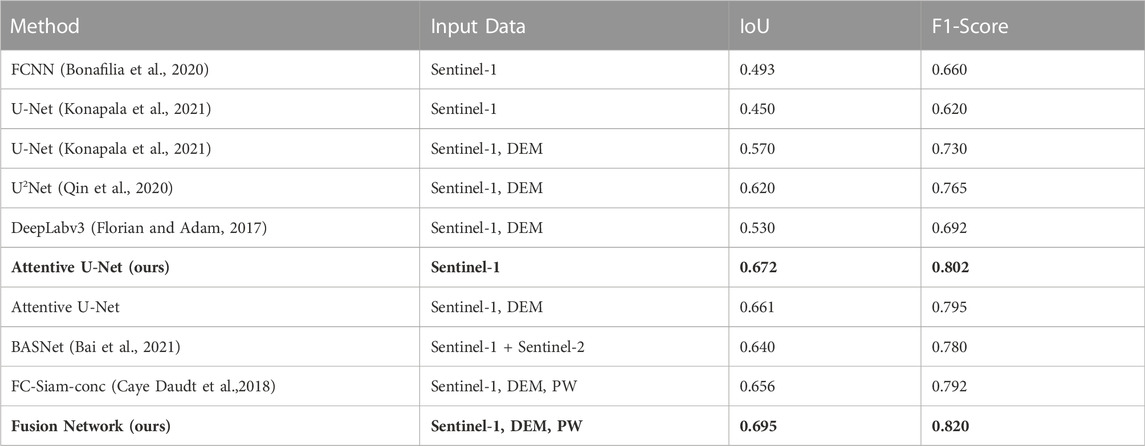
TABLE 1. Quantitative Comparison: Comparison of our Attentive U-Net and Fusion Network method with existing methods. The comparison is made in terms of average IoU and F1 score on test dataset. The best results and corresponding models are highlighted in bold.
The results indicate that both of our proposed networks ‘Attentive U-Net’ and ‘Fusion Network’ outperformed the previous benchmark on Sen1Floods11 dataset. We experimented two data settings with Attentive U-Net. The first setting takes VV/VH/ratio as 3-channel input. In the second setting, we utilize DEM as the third channel, i.e., pass VV, VH, and DEM as 3-channel input to the network. Although the performance of both settings is better than the compared methods, attentive U-Net with DEM show slightly weaker results in comparison to the one with VV/VH/ratio input. The possible reason could be that the ratio channel has more important information in comparison to DEM. Therefore, we experimented further to test the benefit of the DEM and proposed a two-stream network named ‘Fusion Network’. Different combinations of VV, VH, ratio, DEM, and PW were tested before proposing the best-performing fusion network.
Compared to the FCNN baseline, our “Attentive U-net” shows 18% improvement in terms of IoU and 14% improvement in terms of F1 score. “Fusion network” gave a further improvement of 2% i.e., “Fusion network” gave 20% better IoU and 16% better F1 score in comparison to baseline. (Konapala et al., 2021). reported results on U-Net with two data settings, Sentinel-1 data only and both Sentinel-1 and DEM. Our “Attentive U-net” gave a 10%–22% better IoU and 7–18% better F1 score. “Fusion network” gave a boost to the improvements of ‘Attentive U-net’ and resulted in a 12–24% better IoU and a 9%–20% better F1 score.
Similar improvements can be seen compared to the U2Net and DeepLabv3 model. The IoU score on U2Net is better than that of standard U-Net, but could not perform better than the proposed networks. DeepLabv3 performed better than baseline and standard U-Net, but the performance is lower than expected. The possible reason could be that the DeepLabv3 network is too deep and complex. To train this network, we need a larger data set. Unlike computer vision datasets, Sen1Floods11 is smaller dataset and not sufficient to train deep networks like DeepLabv3.
Compared to BASNet, our “Attentive U-Net” shows an improvement of 3% IoU and 2% F1 score. Fusion Network show further improvements in results and gave 5% better IoU and 4% better F1 score. Also when compared with the FC-Siam fusion method, our ‘Fusion Network’ gave 4% better IoU and 3% better F1 score. The possible reason could be residual blocks in the ‘Fusion Network’ which help in overcoming the performance degradation and attentive modules which enhance the important spatial features and channels in the network. Quantitatively, the performance improvement by both proposed segmentation methods is considerable and the results are additionally validated by qualitative analysis.
5.2 Ablation study
The term “ablation study” is borrowed from the medical field and consists of the removal of parts of the nervous system of vertebrates to understand their purpose. This technique was originally introduced by the French physiologist M.J.P. Flourens Britannica (2020). In DL, ablation is the removal or replacement of parts of the network or inputs and analyzing the performance of the resulting model. It helps in investigating the contribution of different parts or techniques used in the DL network.
From the ablation study, we get an idea of the importance of choices made in the final proposed networks. Here we show the ablation study on encoder networks, attention modules, and fusion methods. Furthermore, we tested the impact of different input channels in the two networks. The results from the ablation study are shown in Table 2.
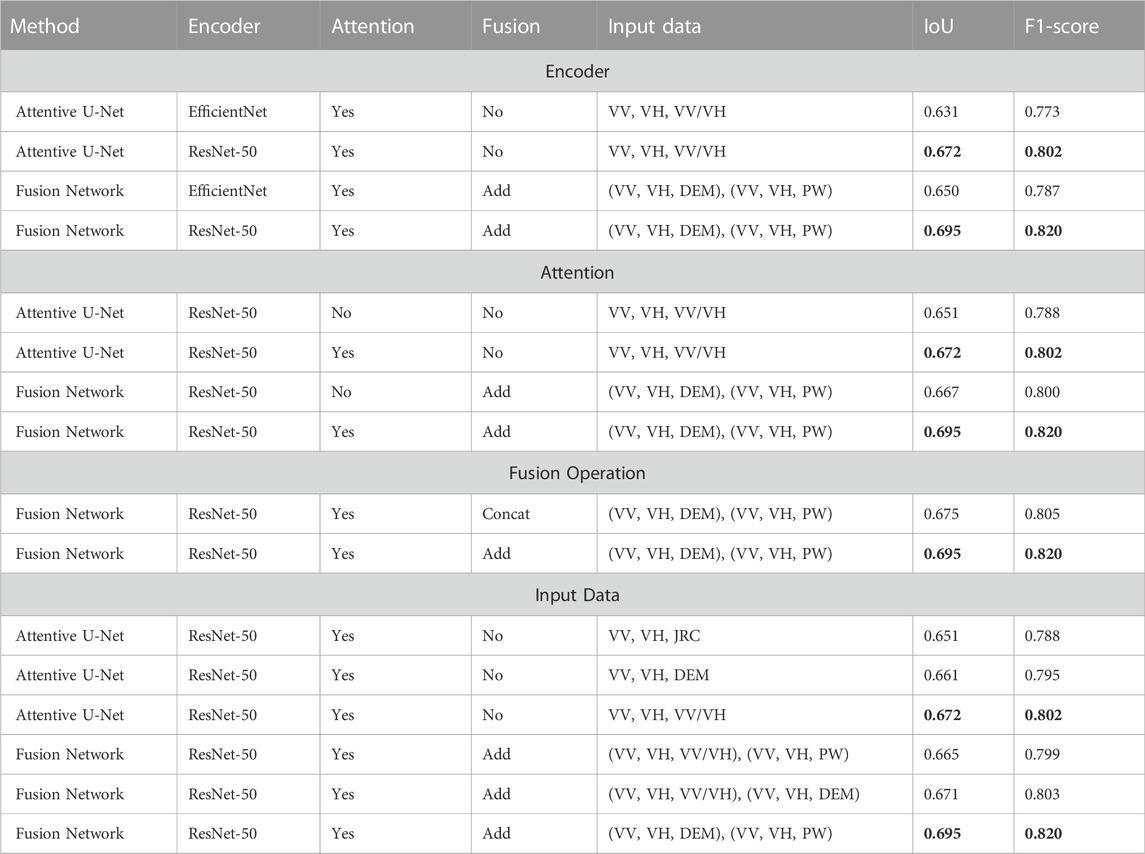
TABLE 2. Ablation Study. The comparison is made in terms of average IoU and F1 score on test dataset. The best scores are highlighted in bold.
We tested the performance of our two proposed networks with different encoders. The table shows the comparison of ResNet-50 (one of the most widely used and successful encoders) and EfficientNet-B4 Tan and Le (2019) (one of the recent and popular encoders). ResNet-50 shows a 4%–5% better IoU score compared to EfficientNet. Both proposed models are tested with and without attention modules. The IoU score is dropped by 2%–3% when we remove attention from the model. The attention module enhances the features giving better segmentation results. We also show the effect of different fusion operations i.e., element-wise addition and concatenation on our fusion network’s performance. The experiment shows that the network performed best with element-wise addition fusion.
The first two input channels of both the “Attentive U-Net” and “Fusion Network” are from Sentinel-1 i.e., VV and VH. For the third channel we tested DEM, PW and ratio (VV/VH). This led to three input combinations per network. In case of “Attentive U-Net”, the best results were obtained with the ratio in the third input channel. The possible reason could be that in this three-channel network setting, the ratio features are more useful compared to DEM and PW masks. In “Fusion Network”, however, a combination of (VV, VH, DEM) and (VV, VH, PW) gave the best results.
5.3 Qualitative results
The qualitative analysis of the proposed methods gives more information on the results. In a large number of cases, both of our proposed networks performed equally well with a slight difference. We choose some of the network predictions where the difference is a bit clear. Three of such samples from the sites in Spain, Sri-Lanka, and Paraguay are shown in Figures 5–7.
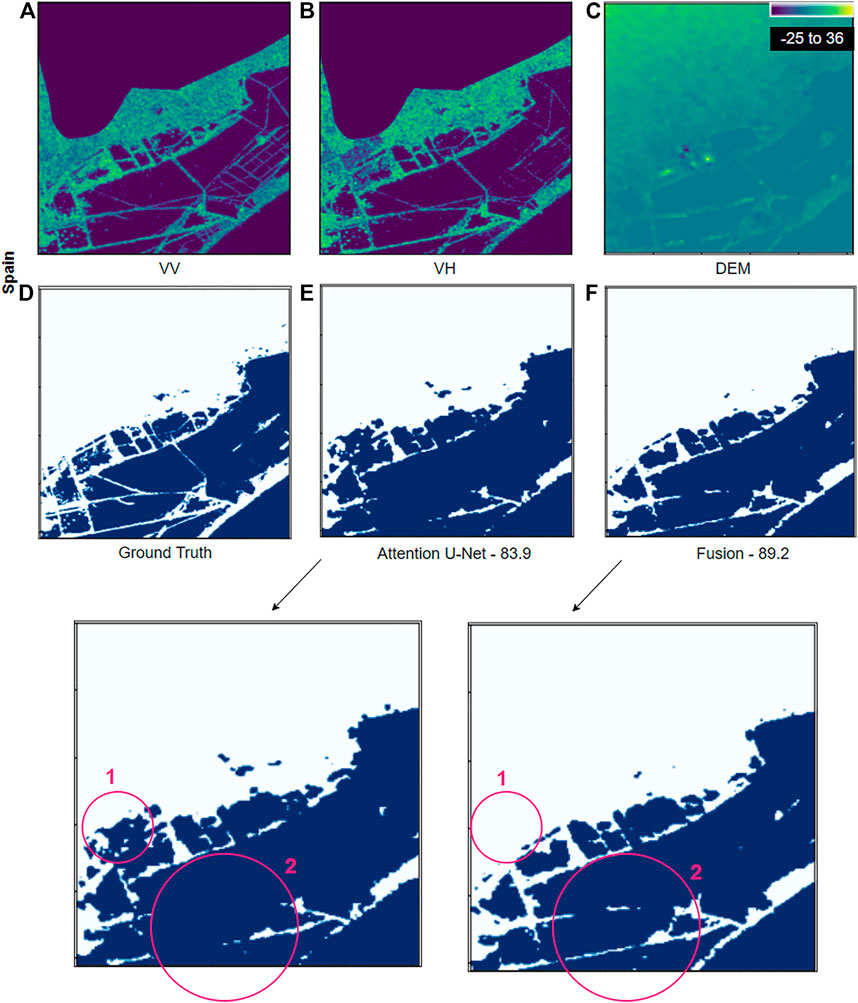
FIGURE 5. Detection result samples from the Spain site. In visualization contains (A) VV, (B) VH, (C) DEM, (D) ground truth, (E) attentive U-Net network prediction, and (F) fusion network prediction. Third row contains zoomed version of (E) and (F). The red circles highlight the areas described in the text. The numbers specified under the prediction maps are the corresponding IoU scores.
Figure 5 shows flood detection results on the Spain site. Both the segmentation results show good IoU scores but the segmentation map from “Fusion Network” is slightly better than the map from “Attention U-Net”. The major differences are highlighted by red circles. The first circle 1) shows the misclassified area in the attentive U-net output and correctly classified in the fusion network output. The second circle 2) highlights the detailed segmentation by the fusion network, where the flooded patches are well separated. Whereas in the segmentation map from attentive U-Net the boundaries are a bit blur and merged.
Figure 6 demonstrates a case from the Sri-Lanka site where the permanent water area (highlighted in red circle 1) is not properly highlighted in the VV channel but is visible in VH with some noise. The last row shows a zoomed version of the output segmentation maps. There are misclassified flood areas (highlighted in red circle 1) in the “Attentive U-Net” detection map, a large percentage of which is correctly classified by the ‘Fusion Network’. The unidentified flooded area in the “Attentive U-Net” detection map is part of permanent water. Since the PW mask is fed attentively in the “Fusion Network”, the network has no trouble detecting this area.
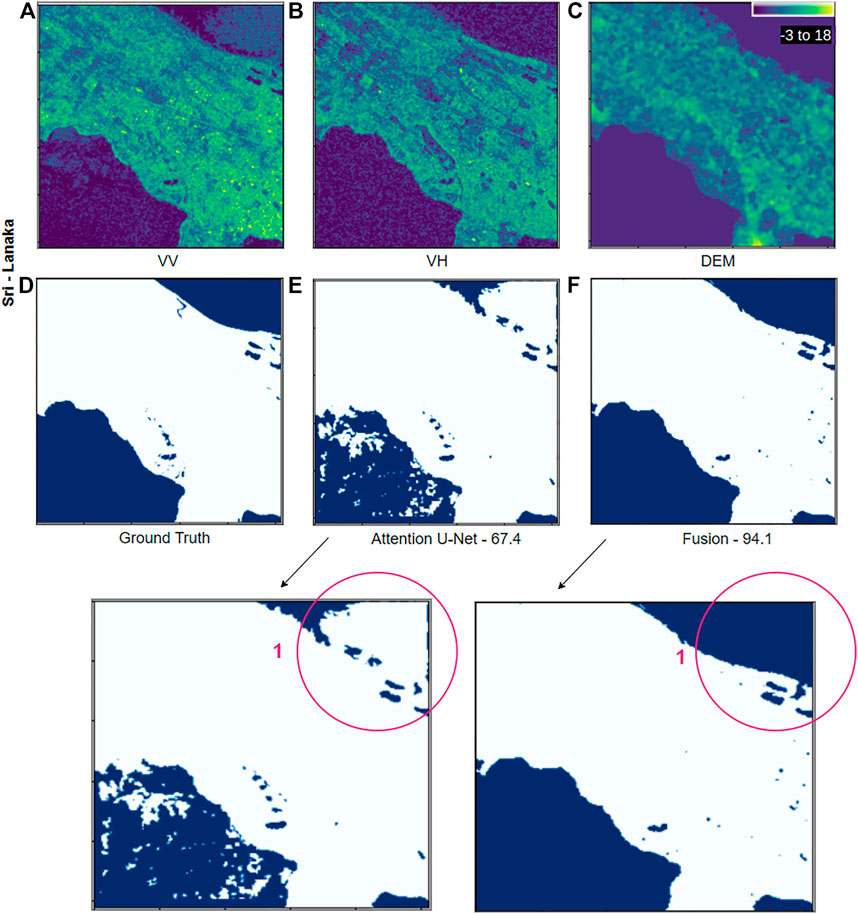
FIGURE 6. Detection result samples from the Spain site. In visualization contains (A) VV, (B) VH, (C) DEM, (D) ground truth, (E) attentive U-Net network prediction and (F) Fusion network prediction. Third row contains zoomed version of (E) and (F). The red circles highlight the areas described in the text. The numbers specified under the prediction maps are the corresponding IoU scores.
Figure 7 shows the flood detection results on the Paraguay site. In the segmentation output from ‘Attentive U-Net’, there are false detections in the upper part of the detection map (highlighted in red circle 1). These false detections are on a high slope (see DEM), and hence cannot be feasibly flooded. Therefore, accommodating an elevation map can reduce false positives from the detection process. The sample presented is one of the many cases where the results from the “Fusion Network” verify the benefits of DEM by removing false positives in high slope areas. Our proposed “Fusion network” accommodates DEM information in a way that enables the network to learn the relationship between the slope of the area and flooding, hence avoiding mentioned false positives. It is important to note that the elevation data is low resolution, which might not help with fine elevation variations, but is helpful on a larger scale.
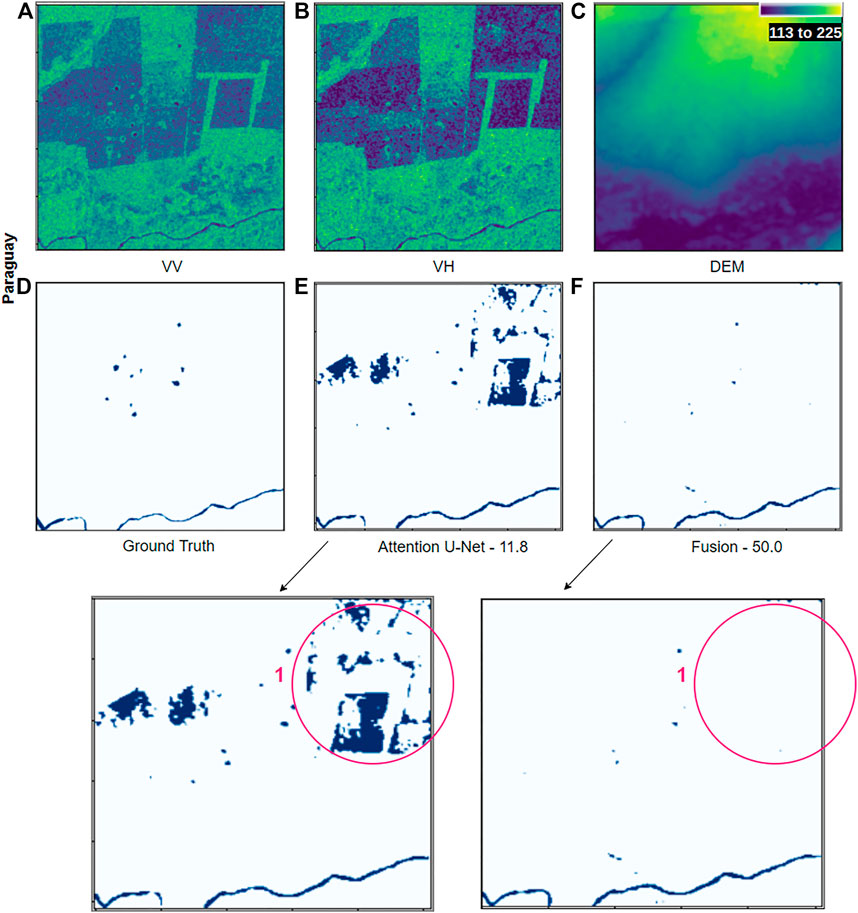
FIGURE 7. Detection result samples from the Spain site. In visualization contains (A) VV, (B) VH, (C) DEM, (D) ground truth, (E) attentive U-Net network prediction and (F) Fusion network prediction. Third row contains zoomed version of (E) and (F). The red circles highlight the areas described in the text. The numbers specified under the prediction maps are the corresponding IoU scores. More samples can be visualized on Google Earth Engine (GEE) Application at https://erritu92.users.earthengine.app/view/flooddetectionunitemporal.
For further analysis, we have developed a GEE application where more results can be visualized and compared on multiple sites. By comparing the predictions from the two proposed methods, we can interpret that DEM and PW contribute significantly toward better flood detection.
5.4 Individual site analysis
Apart from the average scores on test data, we also verify our detection results on each flooded site. The IoU score of our two proposed methods ‘Attentive U-Net’ and ‘Fusion Network’ is compared for each site in the validation set (see Table 3). Major improvements are noticed in the Sri-Lanka, United States, and Paraguay sites where the slope variation is high. For others, both networks achieved similar IoU scores.
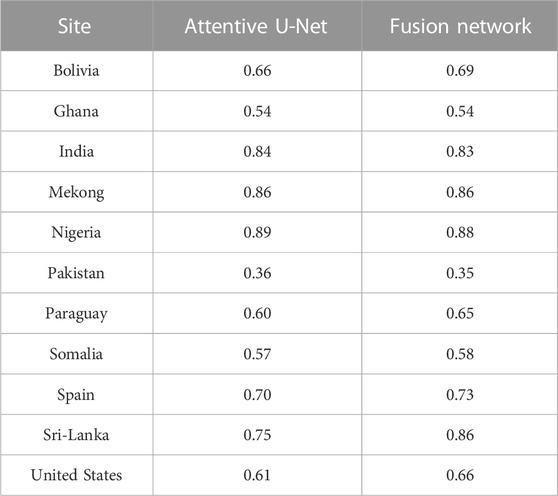
TABLE 3. Performance Comparison of Attentive U-Net and Fusion Network on each site. The displayed numeric values are the average IoU scores calculated on all tiles of the individual site.
A graphical depiction of the sitewise performance is presented in Figure 8. We used a spider graph. The axis of the graph represents the evaluation sites and the numbers on all the concentric circles represent the possible percentage IoU score from 0 at the center to 100 on the outermost circle. The farther toward the end of the spike, the larger the value. Closest to the center means closer to zero. The outermost line represents the best performing model and in the current scenario it is our proposed Fusion Network.
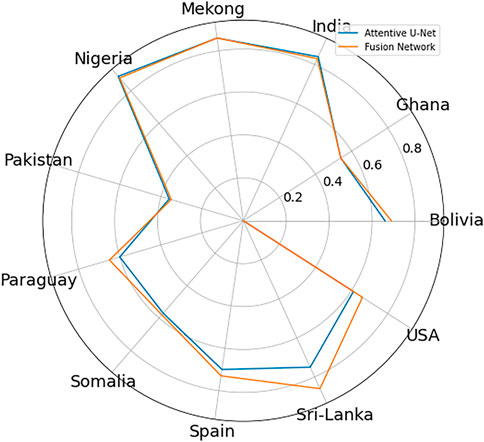
FIGURE 8. Spider Graph: Graphical IoU comparison of our two proposed flood detection methods “Attentive U-Net” and “Fusion Network” on each site.
6 Conclusion
In this study, we presented two architectures for segmenting flooded areas named “Attentive U-Net” and “Fusion Network”. The “Attentive U-Net” utilizes VV, VH, and the ratio of the two. The “Fusion Network” is a novel flood detection method that attentively fuses SAR (VV, VH), DEM, and permanent water masks. Both our proposed methods outperformed the benchmark detection methods on the Sen1Floods11 dataset. “Attentive U-Net” shows an improvement of 4% and “Fusion Network” of 5% in IoU score than the previous benchmarks on Sen1Floods11.
The evaluation and quantitative comparison with the state-of-the-art methods demonstrate the high potential of our proposed flood detection networks. Qualitative evaluation demonstrates that the addition of globally available digital elevation model and a permanent water mask enhances flood detection results. Also, Uni-temporal data is fast (2s per image) to process and consume less memory. The good detection results of our proposed network along with the memory and space efficiency are significant achievements in the direction of onboard satellite processing.
The overreaching goal of our ongoing research is to provide fast, robust, and automatic methods for flood emergency mapping. In the future, we will extend our work to semi-supervised and unsupervised methods, as labeled data are often not readily available. Generating good labels in remote sensing data requires expertise in the field and the low resolution of the data makes it a time-consuming process. Also, removing dependency on labels gives us the freedom to train on abundant sites and the model can then generalize better on unknown sites.
Data availability statement
The original contributions presented in the study are included in the article/Supplementary Material, further inquiries can be directed to the corresponding author.
Author contributions
RY is the first author of this work. AN and YB are her supervisors and second authors.
Acknowledgments
This research is part of the EO-AI4GlobalChange project funded by Digital Futures.
Conflict of interest
The authors declare that the research was conducted in the absence of any commercial or financial relationships that could be construed as a potential conflict of interest.
Publisher’s note
All claims expressed in this article are solely those of the authors and do not necessarily represent those of their affiliated organizations, or those of the publisher, the editors and the reviewers. Any product that may be evaluated in this article, or claim that may be made by its manufacturer, is not guaranteed or endorsed by the publisher.
References
Akiva, P., Purri, M., Dana, K., Tellman, B., and Anderson, T. (2021). “H2o-net: Self-supervised flood segmentation via adversarial domain adaptation and label refinement,” in Proceedings of the IEEE/CVF Winter Conference on Applications of Computer Vision.
Amitrano, D., Di Martino, G., Iodice, A., Riccio, D., and Ruello, G. (2018). Unsupervised rapid flood mapping using sentinel-1 grd sar images. IEEE Trans. Geosci. Remote Sens. 56, 3290–3299. doi:10.1109/tgrs.2018.2797536
Anusha, N., and Bharathi, B. (2020). Flood detection and flood mapping using multi-temporal synthetic aperture radar and optical data. Egypt. J. Remote Sens. Space Sci. 23, 207–219. doi:10.1016/j.ejrs.2019.01.001
Asaro, F., Murdaca, G., and Prati, C. (2021). “Learning deep models from weak labels for water surface segmentation in sar images,” in 2021 IEEE International Geoscience and Remote Sensing Symposium IGARSS.
Bai, Y., Wu, W., Yang, Z., Yu, J., Zhao, B., Liu, X., et al. (2021). Enhancement of detecting permanent water and temporary water in flood disasters by fusing sentinel-1 and sentinel-2 imagery using deep learning algorithms: Demonstration of sen1floods11 benchmark datasets. Remote Sens. 13, 2220. doi:10.3390/rs13112220
Bonafilia, D., Tellman, B., Anderson, T., and Issenberg, E. (2020). “Sen1floods11: A georeferenced dataset to train and test deep learning flood algorithms for sentinel-1,” in Proceedings of the IEEE/CVF Conference on Computer Vision and Pattern Recognition Workshops.
Bullock, J., Cuesta-Lázaro, C., and Quera-Bofarull, A. (2019). Xnet: A convolutional neural network (cnn) implementation for medical x-ray image segmentation suitable for small datasets. Med. Imaging 2019 Biomed. Appl. Mol. Struct. Funct. Imaging 10953, 453–463.
Caye Daudt, R., Le Saux, B., and Boulch, A. (2018). “Fully convolutional siamese networks for change detection,” in 2018 25th IEEE International Conference on Image Processing (ICIP), 4063–4067. doi:10.1109/ICIP.2018.8451652
Cen, M., and Jung, C. (2018). “Fully convolutional siamese fusion networks for object tracking,” in 2018 25th IEEE International Conference on Image Processing (ICIP), 3718–3722. doi:10.1109/ICIP.2018.8451102
Chini, M., Hostache, R., Giustarini, L., and Matgen, P. (2017). A hierarchical split-based approach for parametric thresholding of sar images: Flood inundation as a test case. IEEE Trans. Geosci. Remote Sens. 55, 6975–6988. doi:10.1109/tgrs.2017.2737664
Florian, L.-C., and Adam, S. H. (2017). “Rethinking atrous convolution for semantic image segmentation,” in Conference on computer vision and pattern recognition (CVPR). IEEE/CVF.
García-Pintado, J., Mason, D., Dance, S., Cloke, H., Neal, J. C., Freer, J., et al. (2015). Satellite-supported flood forecasting in river networks: A real case study. J. Hydrology 523, 706–724. doi:10.1016/j.jhydrol.2015.01.084
Garg, S., Motagh, M., and Ghosh, B. (2021). “Automatic flood detection from sentinel-1 data using deep learning: Demonstration of nasa-etci benchmark datasets,” in AGU Fall Meeting Abstracts.
He, K., Zhang, X., Ren, S., and Sun, J. (2016). “Deep residual learning for image recognition,” in Proceedings of the IEEE conference on computer vision and pattern recognition.
Jeon, H., Kim, D., and Kim, J. (2021). “Water body detection using deep learning with sentinel-1 sar satellite data and land cover maps,” in 2021 IEEE International Geoscience and Remote Sensing Symposium IGARSS.
Jung, H. C., and Jasinski, M. F. (2015). Sensitivity of a floodplain hydrodynamic model to satellite-based dem scale and accuracy: Case study–the atchafalaya basin. Remote Sens. 7, 7938–7958. doi:10.3390/rs70607938
Konapala, G., Kumar, S., and Ahmad, S. (2021). Exploring sentinel-1 and sentinel-2 diversity for flood inundation mapping using deep learning. ISPRS J. Photogrammetry Remote Sens. 180, 163–173. doi:10.1016/j.isprsjprs.2021.08.016
Lin, T., Goyal, P., Girshick, R., He, K., and Dollár, P. (2017). “Focal loss for dense object detection,” in Proceedings of the IEEE international conference on computer vision.
Liu, T., Li, Y., Cao, Y., and Shen, Q. (2017). Change detection in multitemporal synthetic aperture radar images using dual-channel convolutional neural network. J. Appl. Remote Sens. 11, 1. doi:10.1117/1.jrs.11.042615
Lu, J., Li, J., Chen, G., Zhao, L., Xiong, B., and Kuang, G. (2015). Improving pixel-based change detection accuracy using an object-based approach in multitemporal sar flood images. IEEE J. Sel. Top. Appl. Earth Obs. Remote Sens. 8, 3486–3496. doi:10.1109/jstars.2015.2416635
Martinis, S. (2017). “Improving flood mapping in arid areas using sentinel-1 time series data,” in 2017 IEEE international geoscience and remote sensing symposium (IGARSS) (IEEE), 193–196.
Mateo-Garcia, G., Veitch-Michaelis, J., Smith, L., Oprea, S., Schumann, G., Gal, Y., et al. (2021). Towards global flood mapping onboard low cost satellites with machine learning. Sci. Rep. 11, 7249. doi:10.1038/s41598-021-86650-z
Moumtzidou, A., Bakratsas, M., Andreadis, S., Karakostas, A., Gialampoukidis, I., Vrochidis, S., et al. (2020). “Flood detection with sentinel-2 satellite images in crisis management systems,” in ISCRAM 2020 Conference Proceedings-17th International Conference on Information Systems for Crisis Response and Management, 1049–1059.
Muthusamy, M., Casado, M. R., Butler, D., and Leinster, P. (2021). Understanding the effects of digital elevation model resolution in urban fluvial flood modelling. J. hydrology 596, 126088. doi:10.1016/j.jhydrol.2021.126088
Nemni, E., Bullock, J., Belabbes, S., and Bromley, L. (2020). Fully convolutional neural network for rapid flood segmentation in synthetic aperture radar imagery. Remote Sens. 12, 2532. doi:10.3390/rs12162532
Pekel, J., Cottam, A., Gorelick, N., and Belward, A. (2016). High-resolution mapping of global surface water and its long-term changes.
Peng, B., Liu, X., Meng, Z., and Huang, Q. (2019). “Urban flood mapping with residual patch similarity learning,” in Proceedings of the 3rd ACM SIGSPATIAL International Workshop on AI for Geographic Knowledge Discovery, 40–47.
Psomiadis, E. (2016). Flash flood area mapping utilising sentinel-1 radar data. Earth Resour. Environ. Remote Sensing/GIS Appl. VII (SPIE) 10005, 382–392.
Qin, X., Zhang, Z., Huang, C., Dehghan, M., Zaiane, O. R., and Jagersand, M. (2020). U2-net: Going deeper with nested u-structure for salient object detection. Pattern Recognit. 106, 107404. doi:10.1016/j.patcog.2020.107404
Qin, X., Zhang, Z., Huang, C., Gao, C., Dehghan, M., and Jagersand, M. (2019). “Basnet: Boundary-aware salient object detection,” in Proceedings of the IEEE/CVF conference on computer vision and pattern recognition, 7479–7489.
Ronneberger, O., Fischer, P., and Brox, T. (2015). “U-net: Convolutional networks for biomedical image segmentation,” in International Conference on Medical image computing and computer-assisted intervention.
Roy, A., Navab, N., and Wachinger, C. (2018). “Concurrent spatial and channel ’squeeze & excitation’in fully convolutional networks,” in International Conference on Medical Image Computing and Computer-Assisted Intervention.
Shen, J., and Tan, F. (2020). Effects of dem resolution and resampling technique on building treatment for urban inundation modeling: A case study for the 2016 flooding of the hust campus in wuhan. Nat. Hazards (Dordr). 104, 927–957. doi:10.1007/s11069-020-04198-z
Sudre, C., Li, W., Vercauteren, T., Ourselin, S., and C, J. (2017). “Generalised dice overlap as a deep learning loss function for highly unbalanced segmentations,” in Deep learning in medical image analysis and multimodal learning for clinical decision support.
Tan, M., and Le, Q. (2019). “Efficientnet: Rethinking model scaling for convolutional neural networks,” in International conference on machine learning, 6105–6114.
Tavus, B., Can, R., and Kocaman, S. (2022). A cnn-based flood mapping approach using sentinel-1 data. ISPRS Ann. Photogramm. Remote Sens. Spat. Inf. Sci. 3, 549–556. doi:10.5194/isprs-annals-v-3-2022-549-2022
Tsyganskaya, V., Martinis, S., Marzahn, P., and Ludwig, R. (2018). Detection of temporary flooded vegetation using sentinel-1 time series data. Remote Sens. 10, 1286. doi:10.3390/rs10081286
Twele, A., Cao, W., Plank, S., and Martinis, S. (2016). Sentinel-1-based flood mapping: A fully automated processing chain. Int. J. Remote Sens. 37, 2990–3004. doi:10.1080/01431161.2016.1192304
Keywords: flood detection, segmentation, SAR, DEM, remote sensing, fusion, deep learning
Citation: Yadav R, Nascetti A and Ban Y (2022) Deep attentive fusion network for flood detection on uni-temporal Sentinel-1 data. Front. Remote Sens. 3:1060144. doi: 10.3389/frsen.2022.1060144
Received: 02 October 2022; Accepted: 22 November 2022;
Published: 14 December 2022.
Edited by:
José Manuel García-Nieto, University of Malaga, SpainReviewed by:
Liangliang Tao, Nanjing University of Information Science and Technology, ChinaMehul S Raval, Ahmedabad University, India
Copyright © 2022 Yadav, Nascetti and Ban . This is an open-access article distributed under the terms of the Creative Commons Attribution License (CC BY). The use, distribution or reproduction in other forums is permitted, provided the original author(s) and the copyright owner(s) are credited and that the original publication in this journal is cited, in accordance with accepted academic practice. No use, distribution or reproduction is permitted which does not comply with these terms.
*Correspondence: Ritu Yadav, rituy@kth.se