Exploring the Potential of Mobile Laser Scanning to Quantify Forest Structural Complexity
 Liane Neudam
 Peter Annighöfer2
  Dominik Seidel
- 1Department of Silviculture and Forest Ecology of the Temperate Zones, Faculty of Forest Sciences, University of Göttingen, Göttingen, Germany
- 2Forest and Agroforest Systems, Technical University of Munich, Freising, Germany
- 3Department of Spatial Structures and Digitization of Forests, Faculty of Forest Sciences, University of Göttingen, Göttingen, Germany
Today, creating or maintaining forest structural complexity is a management paradigm in many countries due to the positive relationships between structural complexity and several forest functions and services. In this study, we tested whether the box-dimension (Db), a holistic and objective measure to describe the structural complexity of trees or forests, can be used to quantify the structural complexity of 14 European beech (Fagus sylvatica L.) dominated forest plots by means of mobile laser scanning (MLS). The goal of this study was to explore the potential of this approach for quantifying the effect of leaves (summer vs winter) and management (lately unmanaged vs managed) on forest structural complexity. The findings suggest that repeated measurements on the same site and at the same time yielded consistent results if the measuring scheme is standardized. The results also showed that standardized measurement protocols allowed quantifying differences in forest structural complexity due to season. The highest stand structural complexity was found in leaf-on condition during summer, with the complexity being significantly higher than in winter condition. Also, in case of our beech-dominated plots, managed forests were more complex in structure than formerly managed but now unmanaged forests. This study illustrates the potential of MLS for monitoring the changes in forest structural complexity and allows correcting stand structural information for seasonality.
1 Introduction
The world’s forests are likely to see a continued and increased pressure from human use (Ammer et al., 2018). At the same time, they are facing changing environmental conditions due to climate change in an unprecedented extent (Krankina et al., 1997; Dale et al., 2001; Millar et al., 2007; Lawler, 2009; Seidl et al., 2011). Precipitation and temperature patterns are changing and result in changes of forest species composition, health and structure (Millar et al., 2007; Lawler, 2009; Seidl et al., 2011). Only recently, it was shown that the structural complexity of unmanaged forests strongly depends on precipitation (Ehbrecht et al., 2021), with the structural complexity of a forest stand being defined as all dimensional, architectural, and distributional patterns of plant individuals and their organs in a given forest space at a given point in time (McElhinny et al., 2005; Seidel et al., 2020). The structural complexity is a characteristic that is often associated with aspired features of a forest, such as increased resilience (D’Amato et al., 2011; Hardiman et al., 2011; Ehbrecht et al., 2017), resistance (Knoke and Seifert, 2008), diversity of lifeforms (Lindenmayer et al., 2000; Neill and Puettmann, 2013), ecosystem stability (Messier et al., 2013) or microclimatic stability (Seidel et al., 2020), and it has become an important paradigm for forest management (Messier et al., 2013). In managed forests, structural complexity can be controlled by the silvicultural practices applied (Jung et al., 2012; Messier et al., 2015; Stiers et al., 2020) and hence management for complexity has been promoted as a tool to halt ecosystem simplification and the loss of biodiversity in managed forests of the temperate zones (Franklin, 1988; Hunter and Hunter, 1999; Lindenmayer et al., 2000).
Against this background, monitoring of structural complexity on landscape scale is a task of increasing importance. The ultimate goal is to monitor such changes at landscape scale from airborne sensors (e.g., Zellweger et al., 2013) or even at global scale through spaceborne remote sensing technologies, e.g., NASA’s global ecosystem dynamic investigation (e.g., Rishmawi et al., 2021). However, ground-truthing remains an important task for such endeavors. Additionally, high-resolution (cm-scale) three-dimensional (3D) information on the forest structure from under the canopy is currently only available from close-range remote sensing approaches like laser scanning or below-canopy photogrammetry. This is particularly true when the focus is on the derivation of measures of structural complexity. In the past, indices of structural complexity were often composed of various measures that address the vertical and horizontal heterogeneity separately and that are later combined in models (e.g., Zellweger et al., 2013) with the aim to pooling attributes in a single index value of structural complexity, as nicely reviewed by earlier works (McElhinny et al., 2005). These approaches are fundamentally different from attempts to directly derive a measure of structural complexity from spatial data. The structural complexity index (SCI) by Zenner and Hibbs (2000) was one of the first of such integrating measures, relying on the height of all trees in a plot and relating the area of the surface created through the tree tops (rugged surface) to the surface area at the forest floor (flat surface). Naturally, measuring the height and position of every tree in a stand is time-consuming and it does not provide direct information on the inner forest strata. Recently, there has been a fast development in approaches that deliver objective and quantitative measures of the position of almost (occlusion effects) all plant elements in a forest. From such approaches, may they be based on light detection and ranging (LiDAR) or structure-from-motion (SFM), the three-dimensional structure of individual trees as well as forest stands became directly accessible (Dassot et al., 2011; Bauwens et al., 2016; Calders et al., 2018; Iglhaut et al., 2019). The remaining task, the integration of the spatial data into tangible indices, has been addressed in the last years. For example, canopy structural complexity, expressed as rugosity (Hardiman et al., 2011; Atkins et al., 2018), overall stand structural complexity, expressed as stand structural complexity index (SSCI; Ehbrecht et al., 2017) or box-dimension (Db; Seidel, 2018), as well as understory structural complexity, expressed by the understory complexity index (UCI; Willim et al., 2019; Seidel et al., 2021) were all derived from 3D forest data and all integrate thousands to millions of measurements of spatial structures into a single number. While some of the new indices fundamentally rely on the use of specific instruments or measurement platforms, the box-dimension can be determined using data from any kind of measurement device or platforms, as long as it results in a 3D point cloud of the object or scene of interest (Seidel, 2018).
Being based on the pioneering work of Mandelbrot (1977), the box-dimension obtained from 3D data was discovered to be a meaningful measure of plant and forest structure in several studies (Seidel, 2018; Seidel et al., 2019a; Seidel et al., 2019b; Guzmán et al., 2020; Arseniou et al., 2021; Dorji et al., 2021; Saarinen et al., 2021). Addressing the structural complexity of trees or forests by means of fractal analysis holds potential for simplifications, since the nested, self-similar structures of vegetation are considered a source for simplicity (Mandelbrot, 1977; Sugihara and May 1990). The pattern of repetition of structures across scales and the distribution and density of the plant material are addressed as one single unifying characteristic (Zeide and Pfeifer, 1991; Kaye, 1994; Jonckheere et al., 2006; Seidel, 2018). This makes the box-dimension approach widely applicable and particularly interesting for large-area investigations or monitoring tasks.
Here, we were interested in 1) whether the complexity assessment based on the box-dimension from mobile laser scanning is affected by different scanning schemes, 2) whether repeated measurements on the same site and with the same measurement protocol yield consistent results and 3) whether the approach can be used to monitor changes in structural complexity due to the phenology (leaf-effect). Finally, 4) to assess the sensitivity of the approach in distinguishing sites that underwent different management regimes, we compared the complexity derived from MLS in managed forests, as well as in forests where management has been abandoned some decades ago.
2 Materials and Methods
2.1 Study Sites
We selected 14 forest stands at four different locations in Germany, namely Göttingen (Lower Saxony), Allstedt (Saxony-Anhalt), Oppershofen (Hesse) and Lübeck (Schleswig-Holstein; Figure 1 and Table 1), covering a gradient in precipitation. The mean annual precipitation between the years 2010 and 2020 ranged from approximately 466.23 mm in Allstedt to 655.33 mm in Lübeck. The mean annual temperature was comparable between the different sites (Table 1). All plots were located in pure stands of European beech (Fagus sylvatica L.) or in beech-dominated stands with 10–15 other broadleaved and coniferous tree species contributing less than 20% basal area in any case. The age of the trees was between 91 and 148 years at the time of the measurement and the forest stands can be differentiated in terms of their management intensity. We selected seven managed and seven formerly managed (now unmanaged) forests. The management of the formerly managed forests was ceased since 26–100 years.
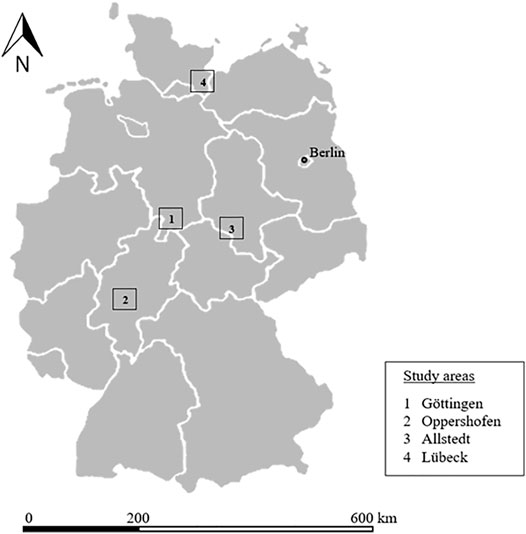
FIGURE 1. Geographic locations of the study areas located in Germany.
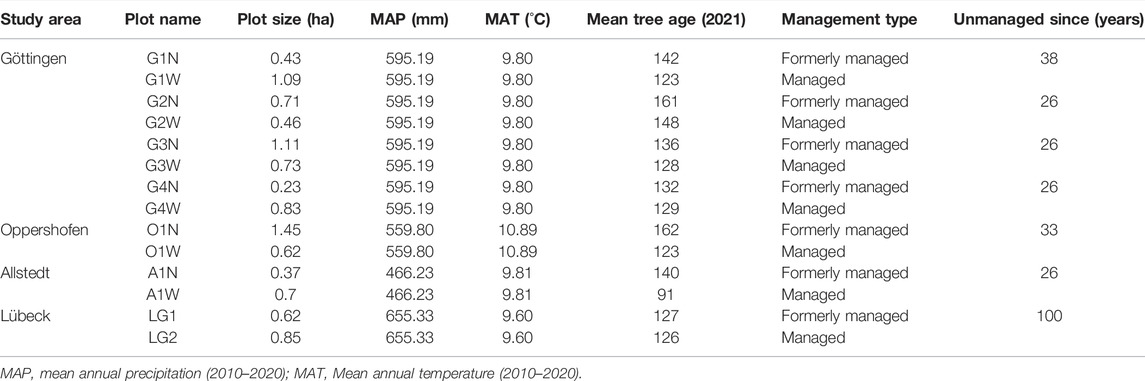
TABLE 1. Detailed information about the climatic and geographic conditions of the study areas and the average age of the studied stands.
2.2 Sampling Design
2.2.1 Effect of Different Scanning Schemes and Reproducibility
The mobile laser scanning was conducted using a ZEB-Horizon (GeoSLAM Ltd., Nottingham, United Kingdom) mobile 3D laser scanner. The device was carried in hand and held towards the direction of walking, facing away from the person carrying it. The recording principle of the Horizon scanner is based on individual laser distance measurements based on the time-of-flight (TOF) principle. With each measurement, the distance between the scanner and each surrounding object at a maximum distance of 100 m was recorded with a range noise of about ±30 mm. The wavelength of the laser is 903 nm and the scan rate was 300,000 points per second.
In order to capture each study site, we first marked the four corner trees of each of the rectangular study plots with a marking tape for a better orientation. After defining a starting point at a random plot corner and marking it temporarily (e.g., by placing a backpack at the position) the scanner was placed on the ground to initiate scanning (self-orientation). Once initiated, the scanner was picked up and the operator (always the same person) walked across the study plot several times in a specific manner while scanning the surroundings. Each scan process was finished after returning to the starting point marker. A complete scan took about 15 min at normal walking speed (∼3 km*h−1) depending on terrain and plot size.
To assess the effects of different scanning schemes on the data obtained for the same site, we scanned one exemplary plot (G4N, see Table 1) repeatedly within the course of 1 hour using five different walking schemes (trajectories). While we used the same starting point (corner of the plot) for all measurements, for the first (standard) measuring scheme we surrounded the four corner trees and thus the entire study area, followed by a diagonal crossing through the area and finally a zig-zag across the plot for better coverage (compare “standard scheme”, Figure 2). The second scheme was characterized by a walk from the starting point to the middle of the plot and then counterclockwise circular in concentric circles of increasing radius from the middle to the edge of the plot. At the edge, we first walked back to the middle of the plot and then to the starting point to finish the scan (compare Figure 2; scheme I). For the second measuring scheme, we walked in a zig-zag pattern with respect to one direction (Figure 2, scheme II). The same was done in scheme III (Figure 2, scheme III) but with zig-zags aligned to a direction perpendicular to scheme II. For the fourth scheme, we used the procedure from the standard scheme as previously described but with the opposing walking direction. First, we followed the zig-zag line through the area with a diagonal crossing and surrounded then the entire study area back to the starting point (compare Figure 2, scheme IV).
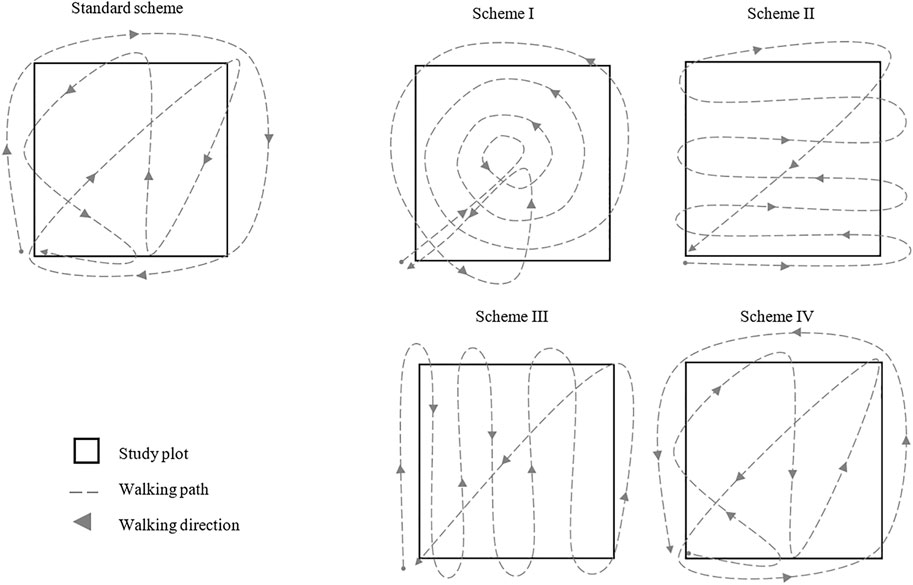
FIGURE 2. Measuring schemes from the standard design for quantifying the reproducibility and the seasonal changes in forest structural complexity (standard scheme) and from the scans made through the course of 1 h with four further different walking paths to quantify the differences between the repeated measurements at the same site (scheme I–IV).
In addition to the different scanning schemes, a set of scans was carried out within shorter intervals to quantify the reproducibility of the data acquired using mobile laser scanning in forests. For this purpose, one plot in Göttingen (G1N, see Table 1) was scanned in varying time intervals, more precisely several times a day, again after 24 h, and again after 1 week according to the pattern described in Table 2. The results (Db-values) of these repeated scans were compared with each other to assess whether the approach delivers consistent data.
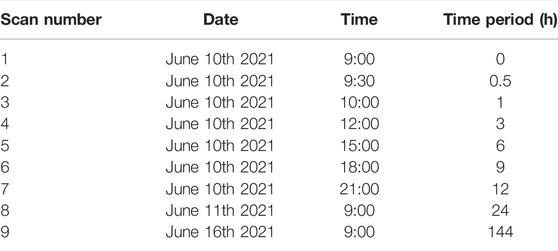
TABLE 2. Date and time of the measurements made on plot G4N to assess the reliability of the MLS approach.
2.2.2 Assessment of Seasonality and Management Effect
To quantify the seasonal changes in forest structural complexity (summer vs winter), scans were collected several times in leaf-off and leaf-on condition, respectively, between March 2020 and February 2021. We ensured to scan only during dry and calm weather conditions to avoid effects of wind or precipitation on the data quality. We split the scan data into two groups, presumable leaf-on (May to October) and presumable leaf-off (November to April), based on the mean of the climatological classification of the phenology for beech of the years 1992–2020 provided by the DWD (Wetterdienst, 2021).
2.3 Point Cloud Processing
The raw data captured by the scanner was transferred to a computer using the onboard data logger and USB exchange portal. Each mobile scan was then processed with the GeoSLAM software provided by the manufacturer of the Horizon (GeoSLAM Ltd., United Kingdom). This processing is based on the simultaneous localization and mapping (SLAM) procedure described in detail in earlier works (e.g., Bosse et al., 2012). Then the data was post-processed as described in Dorji et al. (2021) to create a point cloud of each plot. In brief, we used a laz-file for each scan and the associated trajectory-file (walking path) for orientation and cut the same plot area every time, using the first scan made on each site as a reference in the Open Source CloudCompare software (CloudCompare, v2.10.1, https://www.danielgm.net/cc/). Subsequently, each scan point cloud was subsampled to a 1 cm resolution (down sampling for homogenous point cloud density) and cleaned for outlier points using the noise filter (0.1 m distance).
For the comparison of the derived structural information of the same plots but at different moments in time or from different measurement schemes, it was necessary to use exactly the same area of the plots every time. We focused on a 45 by 45 m area in the center of each plot’s point cloud, an area with greatest probability of high data quality due to the highest density of walk-throughs with the scanner in this central part. To ensure that the area was exactly the same in each of the repeated scans, the subsequent scans of a plot were spatially co-registered to one another using the reference scan (first scan made on each site, see above) for all other scans on the respective site. To do so, each subsequent scan was assigned to the first scan roughly by hand (translation and rotation by hand) and subsequently with the registration tool from CloudCompare (iterative closest point; ICP) for fine registration (error always less than 0.1 m). Hence, for each plot, a 3D point cloud with 45 × 45 m extent was created for further analysis.
Each plot’s 3D point cloud was converted into a voxel model of 20 cm resolution to reduce effects of spatially heterogeneous data density and to enable efficient computing of the large datasets. Afterwards, a terrain-normalisation was conducted for the 20 cm voxel data by correcting each voxel in the voxel model with the underlying terrain height obtained from the digital terrain models as described in Stiers et al. (2020) and Juchheim et al. (2017). The normalized and spatially homogenized data was then used to determine the structural complexity of the forest stands based on the box-dimension (Db, Mandelbrot 1977) using the algorithm introduced by Seidel (2018) and published recently as supplementary material in Arseniou et al. (2021).
2.4 Statistical Analysis
We used parametric and non-parametric tests to analyse the data, depending on whether parametric assumptions were met. For small sample sizes it was necessary to use the Shapiro-Wilk-test as normality-test. We tested the homogeneity of variance by using Levine’s test. In case normal distribution and homogeneity of variance could not be assumed, we used the non-parametric Friedman’s ANOVA test for dependent variables with repeated measurements and the post-hoc test for Friedman’s ANOVA. This was done to test for differences in Db between the seasonal change of leaf-off and leaf-on conditions, between the management type of managed and formerly managed and between the managed forests of leaves emergence and leaves dropping. If the data met the requirements for parametric tests, we used the repeated measures ANOVA to test for differences between the dependent variables. This way, we tested for differences in Db between the leaves emergence and the leaves dropping for the formerly managed forests. For all statistical tests, we used a significance level of p < 0.05. For all statistical tests, we used a significance level of p < 0.05. The statistical analyses were implemented with the software environment R, version 3.6.3 (R Core Team 2020; Vienna, Austria).
3 Results
3.1 Effects of Different Measurement Schemes and Reproducibility
The variation in Db between the highest and the lowest value observed among the scans made on the same site within a single day, with 24 h distance and 1 week later was 0.007 units of Db, always following the same measurement protocol. For the same site on the same day but with different measurement schemes, the range in Db was significantly larger and made up 0.02 units of Db. Finally, for the monthly monitoring of the seasonal pattern on one site the range in Db was found to be 0.04 units of Db. This corresponds to a coefficient of variation of only 0.0009 for repeated measurements of Db on the same site using the same measurement protocol. Based on a mean Db of 2.55 for this plot, the observed range in Db due to repeated measurements corresponds to a difference of 0.28%. The effect of different measurement schemes was larger, accounting to a notable 17.8% of the change observed due to the seasonal changes (summer to winter: 0.04 units of Db). At the same time, if different measurement schemes are conducted, they might result in sampling-related difference in box-dimension that accounted for almost 60% of the changes observed due to the seasonal changes in structure (Table 3).
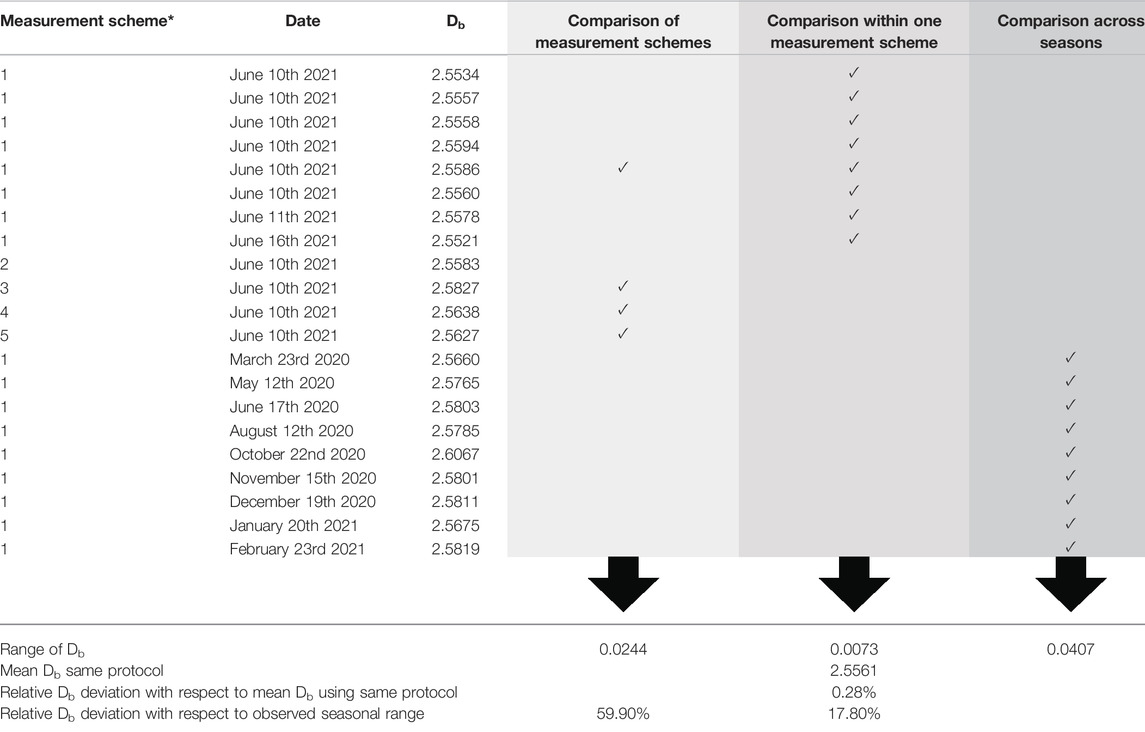
TABLE 3. Range in Db observed among the scans made on the same site with varying measurement schemes (*see Figure 2, Chapter 2.2.1; light grey column) within a single day, 24 h later and after a week (intermediate grey column) and across the seasons (dark grey column). Check marks (✓) indicates that the respective scan in this line was used.
The highest Db was found on the managed study plot in Göttingen in August with 2.66 units of Db and under fully leaved condition of the forest. The lowest Db was observed with 2.37 units of Db on the formerly managed forest stand in Oppershofen in February, without leaves (Figure 3).
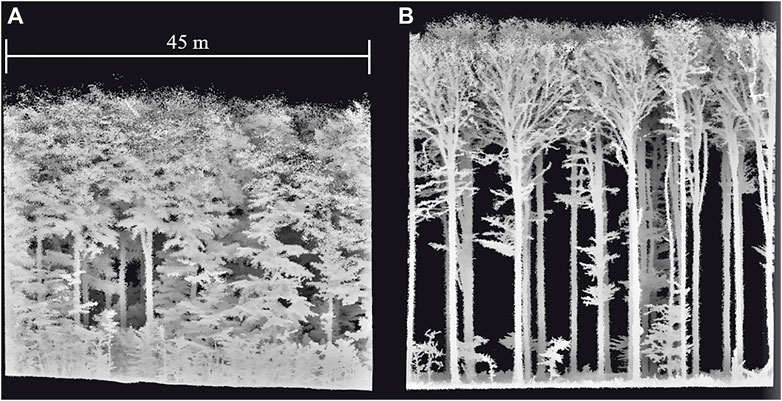
FIGURE 3. Point clouds (45 × 45 m plot area) from the mobile laser scanning in Cloud Compare. (A) From one uneven-aged managed study plot in Göttingen during August with an age of the most dominant trees of 148 years and (B) from the even-aged formerly managed forest stand in Oppershofen in February, during full defoliation with a tree age of 162 years, which is unmanaged since 1988. Figures are in scale.
3.2 Seasonal Changes and Management Effects
The stand structural complexity, assessed via the Db, was found to vary significantly between summer and winter. Figure 4 illustrates the differences in stand structural complexity for each plot between leaf-on and leaf-off condition separately for the managed and unmanaged (formerly managed) sites. Data gaps are due to failed SLAM-processing of acquired scans in GeoSlam.
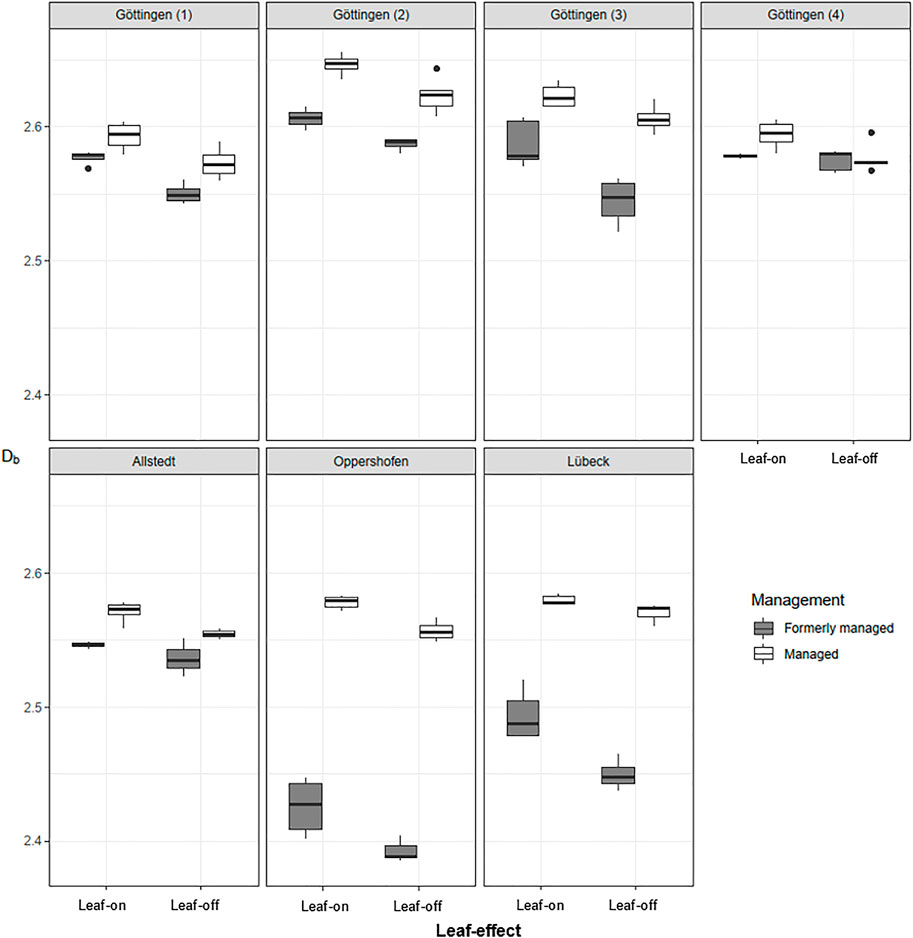
FIGURE 4. Box-Whisker plots of stand structural complexity, expressed as box-dimension (Db), in leaf-on and leaf-off conditions for all 14 study plots and shown separately for the managed and unmanaged sites in each area. We omitted testing for significant differences for individual plots with regard to the leaf-effect and the management due to small sample sizes.
Each plot showed a decrease in structural complexity from the leaf-on to the leaf-off month (compare Table 4). Furthermore, the managed forest stands showed a higher Db than the formerly managed ones on 10 out of 14 sites, except on one plot in Göttingen, the plots in Allstedt and the plots in Lübeck.
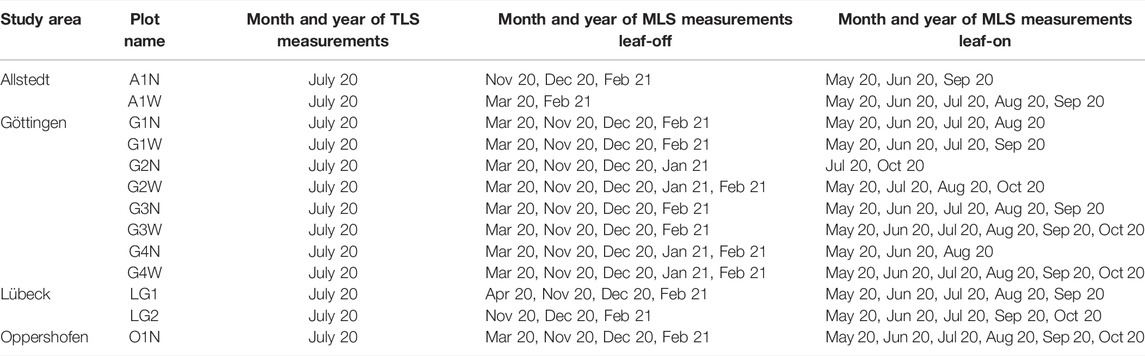
TABLE 4. Data acquisition months for the TLS and MLS. Missing data is due to failed SLAM processing of the data after scanning.
If all plots were considered together, Db was found to be significantly higher during full foliation in summer than in leaf-off winter condition (p < 0.025, Figure 5A) and the difference in means was 0.02 units of Db. A significant difference was also found if all plots were pooled to compared the differences in box-dimension between the managed and unmanaged (but formerly managed) plots (Figure 5B).
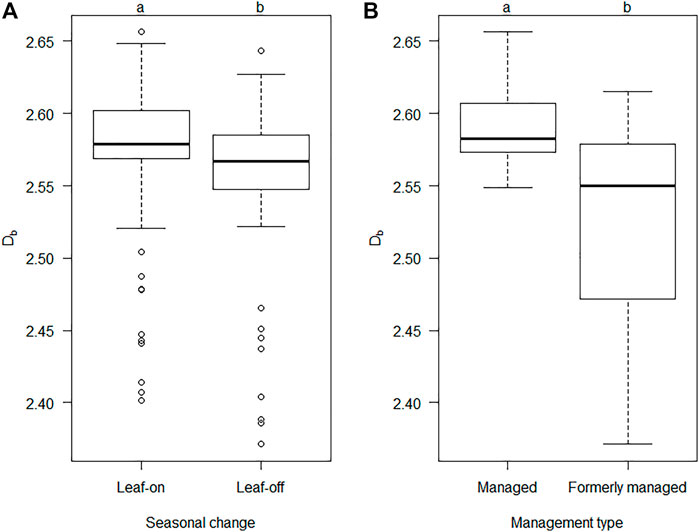
FIGURE 5. Box-Whisker plot of the pooled box-dimension (Db) of all plots for the seasonal change between leaf-on (summer) and leaf-off (winter) conditions (A) and the pooled box-dimension (Db) over different management types (B). Black horizontal lines indicate the median (n = 64 for “Leaf-on” and n = 55 for “Leaf-off”; n = 63 for “Managed”, n = 56 for “Formerly managed”). Different lowercase letters indicate significant differences among the conditions at the level of p < 0.05.
The results showed an increase in structural complexity during spring (difference in Db between April and May) and a decrease during fall (difference in Db between October and November). The effect of leaves emergence on structural complexity was higher than that of leaves dropping during fall and this difference was not significant for the managed plots and not significant for the formerly managed forest, even though a trend was clearly visible (p = 0.051, Figure 6).
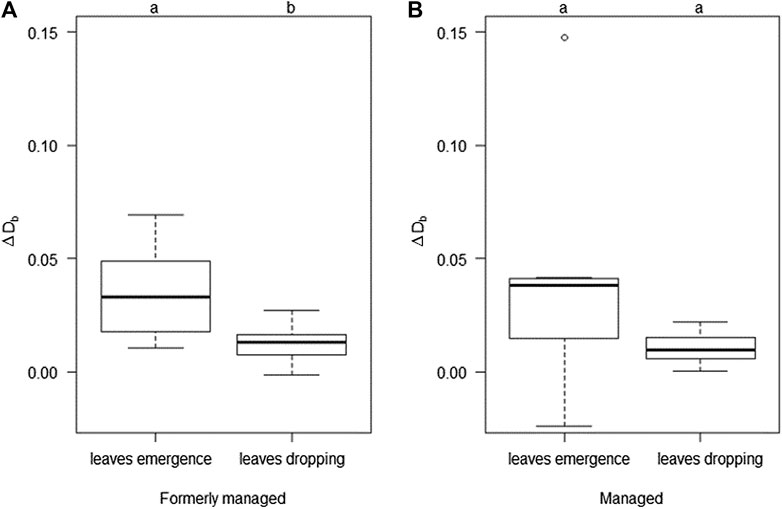
FIGURE 6. Box-Whisker plot of the difference in box-dimension (ΔDb) resulting from the foliation during spring (leaves emergence) and the defoliation during fall (leaves dropping) over the two different management types. Black horizontal lines indicate the median (Formerly managed (A): n = 6 for “leaves emergence” and n = 7 for “leaves dropping”; Managed (B): n = 7 for “leaves emergence” and n = 7 for “leaves dropping”). Lowercase letters indicate significant differences among the conditions at the level of p < 0.05.
4 Discussion
4.1 Effect of Different Measurements Schemes, Reproducibility and Assessment of Seasonal Changes
In this study, we measured the structural complexity of beech-dominated forests, based on the box-dimension (Db), to explore the potential of MLS for providing efficient, reliable and meaningful data on forest structural complexity, e.g. throughout seasonal changes or due to different forest management. The Db, as an holistic approach to stand-level complexity, can help quantifying the change in complexity within a year because it is sensitive to all changes in the amount and distribution of plant material in the investigated space (Seidel et al., 2019a; Arseniou et al., 2021). Therefore, the approach might, for example, be helpful to monitor changes due to reduced forest vitality or altered management approaches. The Db is also an objective measure of structural complexity that is solely mathematically with no prior knowledge on the forest needed. It can theoretically range from one (single linear object = one tree with no branches) to 2.72, which is the dimensionality of the Menger sponge, a mathematical object with the greatest surface to volume ratio (Menger, 1926; Seidel et al., 2019a). Prior studies that have quantified the complexity for individual trees in terms of Db consistently reported values lower than 2.2 in both foliated and defoliated condition (Seidel, 2018; Seidel et al., 2019a; Dorji et al., 2019; Stiers et al., 2020; Arseniou et al., 2021; Saarinen et al., 2021). This can be expected for individual trees (cf. Dorji et al., 2021), since self-shading would result in great inefficiency of values approaching the 2.72 benchmark (Seidel et al., 2019a). When it comes to entire forest stands, as in our study, higher values are to be expected due to niche partitioning and vertical layering in a forest consisting of several trees that are potentially of different size or species. Db values greater than 2 have been reported by earlier studies for foliated beech-dominated forests (Seidel et al., 2019b; Seidel et al., 2020; Stiers et al., 2020) as well as for coniferous forest in many cases (Seidel et al., 2020). In our study, the Db of the point clouds from mobile laser scanning in both conditions, leaf-on and leaf-off, were always greater than 2 across all study plots.
To further evaluate the reliability of MLS-based quantifications of the structural complexity, we compared the results obtained from different measurement schemes during MLS data acquisition as well as different temporal distances. Since the possible variation in Db associated with the application of different measurement schemes (0.02 units) corresponds to about 59% of the change in occurring throughout a year (0.04) we argue that one should avoid changes in the measurement scheme if temporal pattern of forest structures are to be assessed. To allow such temporal (seasonal) monitoring the sampling intensity must be higher than that in our study (∼20 walking minutes per hectare). One could easily increase the sample intensity, e.g., by increasing the walking time and trajectory length to further reduce occlusion in the point cloud in areas not fully sampled. With the same scanning scheme applied in winter and summer, we still have a possible variation of about 17% in the observed differences over time that is solely attributed to the data acquisition process. This might be due the remaining effect of wind during measurement, or, which we assume the more likely explanation, small changes in the walking path resulting in slightly different point clouds for the same forest. This again indicates that a higher sampling rate, in terms of walking time in the stand, must be recommended for plots of the size presented here (∼1 ha). Given a successfully capturing of the entire plot comparisons, a more solid monitoring of changes in structural complexity would be possible and alterations in the walking trajectory will have a decreasing importance. This can hardly be investigated systematically, since identifying an optimal sampling density for all kinds of forests is impossible. We estimate that measuring times of at least 30 min, walking in a slow pace (<4 km*h−1) might be a first guideline for a successful capturing of a ha-sized plot. In our case, using the same MLS measurement scheme was definitely crucial to assess the effect of seasonality on the structural complexity, acknowledging an uncertainty of around 17% in the observed differences between seasons. This however, might partly be related to the fact that the observed seasonal changes of complexity were generally small on our plots, as could be expected, since none of the sites underwent a mortality event or alterations due to management activity. Therefore, differences in complexity arose almost solely from foliation and defoliation (leaf effect). While this was our intention, it might also indicate that more significant changes, as a result of large-scale diebacks, management or other disturbances, might be more easily captured with the presented approach. In literature, we see inconsistent findings when it comes to the effect of leaves on the structural complexity. Leaves may significantly affect the box-dimension of a single tree (Arseniou et al., 2021) or may not, as indicated by Guzmán et al. (2020). We hypothesize this is due to the fact that the trees in Arseniou et al. (2021) were isolated trees growing without competition and they developed a large crown with leaves-bearing branches already at the bottom of the stem. In the study by Guzmán et al. (2020) trees were growing in forest environments, with longer branch free boles. Therefore, the leaf-effect might be smaller for such forest grown trees due to smaller crown ratios. In our study, we could show that significant differences between leaf-on and leaf-off condition exist for real world forest stands and that they can be quantified using MLS despite a small overall annual amplitude. We support the findings by Guzmán et al. (2020), indicating that leaves-bearing trees produce more scattered point clouds than leaf-off trees, thereby increasing the point dispersion in a forest scene and therefore the overall complexity of the stand. We showed that a data-based quantification of structural complexity at a fine resolution and in a holistic manner is possible by using MLS with little effort.
4.2 Effects of Different Management Regimes
The forest stands studied here were all beech-dominated but differed in their management regime. The formerly managed forests have not been managed for 26–100 years. With an age of 91 and 148 years all the forests studied are in the optimum phase, after the main growth stage and before the decay phase (Scherzinger, 1996; Stiers et al., 2018). In unmanaged stands or forests that are managed according to the even-aged management concept, this phase is characterized by the emergence of less structured and single-layered “vault-like” beech forests (German: “Hallenwälder”, Stiers et al., 2018). This structure is caused by the natural reduction in tree numbers due to competition, which affects suppressed and less dominant trees most (Scherzinger, 1996; Boncina, 2000; Meyer, 2005; Feldmann et al., 2018). It is little surprising that the formerly managed and now unmanaged forests that were mostly single-layered in vertical structure when management was ceased, still reflect these structure that are rather low in complexity. Using a space-for-time substitution, Stiers et al. (2018) already showed that the cessation of management in this phase “halts” the development of structural complexity for quite some time. In contrast, the managed beech forests in our study, which have been managed as single-tree selection systems (uneven-aged forestry) showed a significantly higher stand structural complexity than their counterparts on all study sites.
The traditional even-aged system of forest management in Germany is constantly being replaced in the last decades by finer grained regeneration systems based on the final harvest of single trees (target diameter harvest), or groups of trees only. Thus, the creation of larger gaps was restricted to few cases aiming at promoting tree regeneration, resulting in uneven-aged forests (Puettmann et al., 2015; Schall et al., 2018). The inter-mixed developmental phases by the single tree selection approach leads to increased structural heterogeneity, which is reflected in a high variation in neighboring trees of different ages and sizes (Schall et al., 2018). It is assumed that the management practices, such as single-tree or group-selection, imitate gap dynamics and natural regeneration processes in the decay phase and have a positive effect on the stand structure complexity (Commarmot et al., 2005; Stiers et al., 2018). Our data supports this, as we observed a higher structural complexity in our managed forests. Stands managed for complexity by following the guidelines of continuous-cover-forestry were shown to develop a structural complexity that can even reach the level of primary beech forest in terms of the box-dimension in some cases (Stiers et al., 2020).
The higher Db in our managed plots indicates a more homogeneous vertical and horizontal distribution of plant material in these forests. Consequently, the effect of leaves emergence in the managed forests was greater than in the formerly managed forests. If leaves emerge across many vertical layers, their contribution to the overall complexity will also be greater. Stiers et al. (2020) and Willim et al. (2019) showed this effect for managed beech forests. A greater effect on structural complexity observed as a result of leaves emergence, when compare to leaves fall, might partly be explained by the persistence of dead leaves on the trees until spring, since this delays the effect of leaves loss. In addition, the growth of twigs, branches and the stems during the course of the year might also result in a slightly increased overall complexity during fall, when compare to the conditions before the start of the growing season.
4.3 Methodological Considerations
The box-dimension quantifies structures holistically, that is without distinguishing between individual objects, solely in terms of the spatial point distribution in the point cloud and the amount of material present (distribution and density). Additional attributes, like the health status of trees, woody debris on the forest ground, number of microhabitats or species diversity are not explicitly addressed but may be important aspects of complexity. In our study, we hence focused on structural complexity in its strictest mathematical sense. We cannot make statements regarding those other aspects of complexity.
While differences among the study sites are not in the focus of the analysis presented here, it is worth mentioning that slopes might positively affect the structural complexity of forests. Sloped sites naturally have a more pronounced vertical layering and even after a terrain normalization these effects can still be apparent. However, slope angles were rather low on all our plots and we could not see any relationship between slope angle and plot complexity (data not shown).
5 Conclusion
In this study, we demonstrated the use of the highly efficient mobile laser scanning technology, more precisely hand-held laser scanning, to produce detailed 3D data of forests that can be used to quantify forest structural complexity by means of fractal analysis. The approach was successfully used to quantify the effect of leaves emergence and leaves fall on structural complexity in beech-dominated forests. Additionally, we could show that structural differences that result from different management regimes could successfully be measured. Our study also clearly showed that, despite its wide applicability, MLS requires a standardized scanning procedure (walking scheme) to generate repeatable measurements of Db. This limitation can likely be overcome if a greater sampling density is applied to avoid occlusion effects as much as possible. We conclude that the presented approach can be used for monitoring structural complexity in forest stands in an objective and efficient manner, with little training needed for field operators. It provides math-based quantifications of complexity that might be useful for certification procedures, monitoring protocols or any other evidence-based assessment of forest structural complexity. This can put management for complexity on solid ground, since status and direction of development in terms of structural complexity can be obtained objectively for any given forest.
Data Availability Statement
The raw data supporting the conclusions of this article will be made available by the authors, without undue reservation.
Author Contributions
LN and DS contributed to conception and design of the study. LN organized the database. LN performed the statistical analysis. LN, PA and DS wrote the first draft of the manuscript. All authors contributed to manuscript revision, read, and approved the submitted version.
Funding
The German Research Foundation (DFG) is acknowledge for funding the contributions of DS through the Heisenberg program (SE 2383/7-1) “Drivers and passengers of structural complexity in forests”. The research project was carried out as part of the support for achieving the climate goals of the Federal Government and was supervised by the FNR (Fachagentur Nachwachsende Rohstoffe e. V.; funding no. FKZ 2218WK1214). It was financially supported by the Federal Ministry of Food and Agriculture (BMEL) and the Federal Ministry for Environment, Nature Conservation and Nuclear Safety (BMU) through the Waldklimafonds based on a decision taken by the German Bundestag.
Conflict of Interest
The authors declare that the research was conducted in the absence of any commercial or financial relationships that could be construed as a potential conflict of interest.
Publisher’s Note
All claims expressed in this article are solely those of the authors and do not necessarily represent those of their affiliated organizations, or those of the publisher, the editors and the reviewers. Any product that may be evaluated in this article, or claim that may be made by its manufacturer, is not guaranteed or endorsed by the publisher.
Acknowledgments
We gratefully acknowledge the support by the Open Access Publication Funds of the Göttingen University.
References
Ammer, C., Fichtner, A., Fischer, A., Gossner, M. M., Meyer, P., Seidl, R., et al. (2018). Key Ecological Research Questions for Central European Forests. Basic Appl. Ecol. 32, 3–25. doi:10.1016/j.baae.2018.07.006
Arseniou, G., MacFarlane, D. W., and Seidel, D. (2021). Measuring the Contribution of Leaves to the Structural Complexity of Urban Tree Crowns with Terrestrial Laser Scanning. Remote Sensing 13, 2773. doi:10.3390/rs13142773
Atkins, J. W., Fahey, R. T., Hardiman, B. H., and Gough, C. M. (2018). Forest Canopy Structural Complexity and Light Absorption Relationships at the Subcontinental Scale. J. Geophys. Res. Biogeosci. 123, 1387–1405. doi:10.1002/2017JG004256
Bauwens, S., Bartholomeus, H., Calders, K., and Lejeune, P. (2016). Forest Inventory with Terrestrial LiDAR: A Comparison of Static and Hand-Held Mobile Laser Scanning. Forests 7, 127. doi:10.3390/f7060127
Boncina, A. (2000). Comparison of Structure and Biodiversity in the Rajhenav virgin forest Remnant and Managed forest in the Dinaric Region of Slovenia. Glob. Ecol. Biogeogr. 9, 201–211. doi:10.1046/j.1365-2699.2000.00155.x
Bosse, M., Zlot, R., and Flick, P. (2012). Zebedee: Design of a spring-mounted 3-d Range Sensor with Application to mobile Mapping. IEEE Trans. Robot. 28, 1104–1119. doi:10.1109/tro.2012.2200990
Calders, K., Origo, N., Burt, A., Disney, M., Nightingale, J., Raumonen, P., et al. (2018). Realistic Forest Stand Reconstruction from Terrestrial LiDAR for Radiative Transfer Modelling. Remote Sensing 10, 933. doi:10.3390/rs10060933
Commarmot, B., Bachofen, H., Bundziak, Y., Bürgi, A., and Zingg, A. (2005). Structure of virgin and Managed Beech Forests in Uholka (Ukraine) and Sihlwald (Switzerland). For. Snow Landscape Res. 79.
Dale, V. H., Joyce, L. A., McNulty, S., Neilson, R. P., Ayres, M. P., Flannigan, M. D., et al. (2001). Climate Change and Forest Disturbances. BioScience 51, 723. doi:10.1641/0006-3568(2001)051[0723:ccafd]2.0.co;2
D’Amato, A. W., Bradford, J. B., Fraver, S., and Palik, B. J. (2011). Forest Management for Mitigation and Adaptation to Climate Change: Insights from Long-Term Silviculture Experiments. For. Ecol. Manag. 262, 803–816. doi:10.1016/j.foreco.2011.05.014
Dassot, M., Constant, T., and Fournier, M. (2011). The Use of Terrestrial LiDAR Technology in forest Science: Application fields, Benefits and Challenges. Ann. For. Sci. 68, 959–974. doi:10.1007/s13595-011-0102-2
Dorji, Y., Annighöfer, P., Ammer, C., and Seidel, D. (2019). Response of Beech (Fagus Sylvatica L.) Trees to Competition-New Insights from Using Fractal Analysis. Remote Sensing 11, 2656. doi:10.3390/rs11222656
Dorji, Y., Schuldt, B., Neudam, L., Dorji, R., Middleby, K., Isasa, E., et al. (2021). Three-dimensional Quantification of Tree Architecture from mobile Laser Scanning and Geometry Analysis. Trees 35, 1385–1398. doi:10.1007/s00468-021-02124-9
Ehbrecht, M., Schall, P., Ammer, C., and Seidel, D. (2017). Quantifying Stand Structural Complexity and its Relationship with forest Management, Tree Species Diversity and Microclimate. Agric. For. Meteorology 242, 1–9. doi:10.1016/j.agrformet.2017.04.012
Ehbrecht, M., Seidel, D., Annighöfer, P., Kreft, H., Köhler, M., and Zemp, D. C. (2021). Global Patterns and Climatic Controls of Forest Structural Complexity. Nat Commun 12, 519. doi:10.1038/s41467-020-20767-z
Feldmann, E., Drößler, L., Hauck, M., Kucbel, S., Pichler, V., Leuschner, C., et al. (2018). Canopy gap Dynamics and Tree Understory Release in a virgin Beech forest, Slovakian Carpathians. For. Ecol. Manag. 415-416, 38–46. doi:10.1016/j.foreco.2018.02.022
Franklin, J. F. (1988). “Structural and Functional Diversity in Temperate Forests,” in Biodiversity. Editor E O. Wilson (Washington, D.C.: National Academy Press), 166–175.
Guzmán Q., J. A., Sharp, I., Alencastro, F., and Sánchez‐Azofeifa, G. A. (2020). On the Relationship of Fractal Geometry and Tree-Stand Metrics on point Clouds Derived from Terrestrial Laser Scanning. Methods Ecol. Evol. 11, 1309–1318. doi:10.1111/2041-210X.13437
Hardiman, B. S., Bohrer, G., Gough, C. M., Vogel, C. S., and Curtis, P. S. (2011). The Role of Canopy Structural Complexity in wood Net Primary Production of a Maturing Northern Deciduous forest. Ecology 92, 1818–1827. doi:10.1890/10-2192.1
Hunter, M. L., and Hunter, M. L. (1999). Maintaining Biodiversity in Forest Ecosystems. Cambridge: Cambridge University Press.
Iglhaut, J., Cabo, C., Puliti, S., Piermattei, L., O’Connor, J., and Rosette, J. (2019). Structure from Motion Photogrammetry in Forestry: a Review. Curr. For. Rep 5, 155–168. doi:10.1007/s40725-019-00094-3
Jonckheere, I., Nackaerts, K., Muys, B., van Aardt, J., and Coppin, P. (2006). A Fractal Dimension-Based Modelling Approach for Studying the Effect of Leaf Distribution on LAI Retrieval in forest Canopies. Ecol. Model. 197, 179–195. doi:10.1016/j.ecolmodel.2006.02.036
Juchheim, J., Ammer, C., Schall, P., and Seidel, D. (2017). Canopy Space Filling Rather Than Conventional Measures of Structural Diversity Explains Productivity of Beech Stands. Forest Ecology and Management 395, 19–26. doi:10.1016/j.foreco.2017.03.036
Jung, K., Kaiser, S., Böhm, S., Nieschulze, J., and Kalko, E. K. V. (2012). Moving in Three Dimensions: Effects of Structural Complexity on Occurrence and Activity of Insectivorous Bats in Managed forest Stands. J. Appl. Ecol. 49, 523–531. doi:10.1111/j.1365-2664.2012.02116.x
Knoke, T., and Seifert, T. (2008). Integrating Selected Ecological Effects of Mixed European Beech-Norway spruce Stands in Bioeconomic Modelling. Ecol. Model. 210, 487–498. doi:10.1016/j.ecolmodel.2007.08.011
Krankina, O. N., Dixon, R. K., Kirilenko, A. P., and Kobak, K. I. (1997). Global Climate Change Adaption: Examples from Russian Boreal Forests. Climatic Change 36, 197–215. doi:10.1023/A:1005348614843
Lawler, J. J. (2009). Climate Change Adaptation Strategies for Resource Management and Conservation Planning. Ann. N. Y Acad. Sci. 1162, 79–98. doi:10.1111/j.1749-6632.2009.04147.x
Lindenmayer, D. B., Margules, C. R., and Botkin, D. B. (2000). Indicators of Biodiversity for Ecologically Sustainable Forest Management. Conservation Biol. 14, 941–950. doi:10.1046/j.1523-1739.2000.98533.x
McElhinny, C., Gibbons, P., Brack, C., and Bauhus, J. (2005). Forest and woodland Stand Structural Complexity: Its Definition and Measurement. For. Ecol. Manag. 218, 1–24. doi:10.1016/j.foreco.2005.08.034
Menger, K. (1926). Über die Dimension von Punktmengen. Monatsh. F. Mathematik Physik 34, 137–161. doi:10.1007/bf01694895
Messier, C. C., Puettmann, K. J., and Coates, K. D. (2013). Managing Forests as Complex Adaptive Systems. Buildingresilience to the challenge of Global Change. London: Routledge.
Messier, C., Puettmann, K., Chazdon, R., Andersson, K. P., Angers, V. A., Brotons, L., et al. (2015). From Management to Stewardship: Viewing Forests as Complex Adaptive Systems in an Uncertain World. Conservation Letters 8, 368–377. doi:10.1111/conl.12156
Meyer, P. (2005). Network of Strict Forest Reserves as Reference System for Close to Nature Forestry in Lower Saxony. Germany: Forest Snow and Landscape Research.
Millar, C. I., Stephenson, N. L., and Stephens, S. L. (2007). Climate Change and Forests of the Future: Managing in the Face of Uncertainty. Ecol. Appl. 17, 2145–2151. doi:10.1890/06-1715.1
Neill, A. R., and Puettmann, K. J. (2013). Managing for Adaptive Capacity: Thinning Improves Food Availability for Wildlife and Insect Pollinators under Climate Change Conditions. Can. J. For. Res. 43, 428–440. doi:10.1139/cjfr-2012-0345
Puettmann, K. J., Wilson, S. M., Baker, S. C., Donoso, P. J., Drössler, L., Amente, G., et al. (2015). Silvicultural Alternatives to Conventional Even-Aged forest Management - what Limits Global Adoption? For. Ecosyst. 2. doi:10.1186/s40663-015-0031-x
Rishmawi, K., Huang, C., and Zhan, X. (2021). Monitoring Key Forest Structure Attributes across the Conterminous United States by Integrating GEDI LiDAR Measurements and VIIRS Data. Remote Sensing 13, 442. doi:10.3390/rs13030442
Saarinen, N., Calders, K., Kankare, V., Yrttimaa, T., Junttila, S., Luoma, V., et al. (2021). Understanding 3D Structural Complexity of Individual Scots pine Trees with Different Management History. Ecol. Evol. 11, 2561–2572. doi:10.1002/ece3.7216
Schall, P., Gossner, M. M., Heinrichs, S., Fischer, M., Boch, S., Prati, D., et al. (2018). The Impact of Even-Aged and Uneven-Aged forest Management on Regional Biodiversity of Multiple Taxa in European Beech Forests. J. Appl. Ecol. 55, 267–278. doi:10.1111/1365-2664.12950
Scherzinger, W. (1996). Naturschutz im Wald, Qualitätsziele einer dynamischen Waldentwicklung. Stuttgart: Ulmer.
Seidel, D. (2018). A Holistic Approach to Determine Tree Structural Complexity Based on Laser Scanning Data and Fractal Analysis. Ecol. Evol. 8, 128–134. doi:10.1002/ece3.3661
Seidel, D., Annighöfer, P., Ammer, C., Ehbrecht, M., Willim, K., Bannister, J., et al. (2021). Quantifying Understory Complexity in Unmanaged Forests Using TLS and Identifying Some of its Major Drivers. Remote Sensing 13, 1513. doi:10.3390/rs13081513
Seidel, D., Annighöfer, P., Ehbrecht, M., Magdon, P., Wöllauer, S., and Ammer, C. (2020). Deriving Stand Structural Complexity from Airborne Laser Scanning Data-What Does it Tell Us about a Forest? Remote Sensing 12, 1854. doi:10.3390/rs12111854
Seidel, D., Annighöfer, P., Stiers, M., Zemp, C. D., Burkardt, K., Ehbrecht, M., et al. (2019a). How a Measure of Tree Structural Complexity Relates to Architectural Benefit‐to‐cost Ratio, Light Availability, and Growth of Trees. Ecol. Evol. 9, 7134–7142. doi:10.1002/ece3.5281
Seidel, D., Ehbrecht, M., Annighöfer, P., and Ammer, C. (2019b). From Tree to Stand-Level Structural Complexity - Which Properties Make a forest Stand Complex? Agric. For. Meteorology 278, 107699. doi:10.1016/j.agrformet.2019.107699
Seidl, R., Rammer, W., and Lexer, M. J. (2011). Adaptation Options to Reduce Climate Change Vulnerability of Sustainable forest Management in the Austrian Alps. Can. J. For. Res. 41, 694–706. doi:10.1139/X10-235
Stiers, M., Annighöfer, P., Seidel, D., Willim, K., Neudam, L., and Ammer, C. (2020). Quantifying the Target State of forest Stands Managed with the Continuous Cover Approach - Revisiting Möller's "Dauerwald" Concept after 100 Years. Trees, Forests and People 1, 100004. doi:10.1016/j.tfp.2020.100004
Stiers, M., Willim, K., Seidel, D., Ehbrecht, M., Kabal, M., Ammer, C., et al. (2018). A Quantitative Comparison of the Structural Complexity of Managed, Lately Unmanaged and Primary European Beech (Fagus Sylvatica L.) Forests. For. Ecol. Manag. 430, 357–365. doi:10.1016/j.foreco.2018.08.039
Sugihara, G., and M. May, R. (1990). Applications of Fractals in Ecology. Trends Ecol. Evol. 5, 79–86. doi:10.1016/0169-5347(90)90235-6
Wetterdienst, D. (2021). Wetter und Klima - Deutscher Wetterdienst - Pflanzenentwicklung - Klimatologische Einordnung der Phänologie. Available at: https://www.dwd.de/DE/leistungen/phaeno_etermine/phaenoetermine.html;jsessionid=07FE77EAB5652E98A0542CB4FF56CA72.live31091?nn=588524# (Accessed September 08, 2021).
Willim, K., Stiers, M., Annighöfer, P., Ammer, C., Ehbrecht, M., Kabal, M., et al. (2019). Assessing Understory Complexity in Beech-Dominated Forests (Fagus Sylvatica L.) in Central Europe-From Managed to Primary Forests. Sensors 19, 1684. doi:10.3390/s19071684
Zeide, B., and Pfeifer, P. (1991). A Method for Estimation of Fractal Dimension of Tree Crowns. For. Sci. 37, 1253–1265.
Zellweger, F., Braunisch, V., Baltensweiler, A., and Bollmann, K. (2013). Remotely Sensed forest Structural Complexity Predicts Multi Species Occurrence at the Landscape Scale. For. Ecol. Manag. 307, 303–312. doi:10.1016/j.foreco.2013.07.023
Keywords: stand stucture, structure complexity, mobile laser scanning, fagus silvatica L., box-dimension
Citation: Neudam L, Annighöfer P and Seidel D (2022) Exploring the Potential of Mobile Laser Scanning to Quantify Forest Structural Complexity. Front. Remote Sens. 3:861337. doi: 10.3389/frsen.2022.861337
Received: 24 January 2022; Accepted: 25 February 2022;
Published: 07 April 2022.
Edited by:
Yanjun Su, Institute of Botany, (CAS), ChinaReviewed by:
Tianyu Hu, Beijing Botanical Garden, Institute of Botany, (CAS), ChinaJ. Antonio Guzmán Q., University of Minnesota Twin Cities, United States
Copyright © 2022 Neudam, Annighöfer and Seidel. This is an open-access article distributed under the terms of the Creative Commons Attribution License (CC BY). The use, distribution or reproduction in other forums is permitted, provided the original author(s) and the copyright owner(s) are credited and that the original publication in this journal is cited, in accordance with accepted academic practice. No use, distribution or reproduction is permitted which does not comply with these terms.
*Correspondence: Liane Neudam, liane.neudam@uni-goettingen.de