Integrating Angular Backscatter Response Analysis Derivatives Into a Hierarchical Classification for Habitat Mapping
 Peter Porskamp
 Mary Young
 Alex Rattray1
  Craig J. Brown
 Daniel Ierodiaconou
- 1Centre for Integrative Ecology, School of Life and Environmental Sciences, Deakin University, Warrnambool, VIC, Australia
- 2Department of Oceanography, Dalhousie University, Halifax, NS, Canada
- 3Razak Faculty of Technology and Informatics, Universiti Teknologi Malaysia, Johor Bahru, Malaysia
Accurate maps of biological communities are essential for monitoring and managing marine protected areas but more information on the most effective methods for developing these maps is needed. In this study, we use Wilsons Promontory Marine National Park in southeast Australia as a case study to determine the best combination of variables and scales for producing accurate habitat maps across the site. Wilsons Promontory has full multibeam echosounder (MBES) coverage coupled with towed video, remotely operated underwater vehicle (ROV) and drop video observations. Our study used an image segmentation approach incorporating MBES backscatter angular response curve and bathymetry derivatives to identify benthic community types using a hierarchical habitat classification scheme. The angular response curve data were extracted from MBES data using two different methods: 1) angular range analysis (ARA) and 2) backscatter angular response (AR). Habitat distributions were predicted using a supervised Random Forest approach combining bathymetry, ARA, and AR derivatives. Variable importance metrics indicated that ARA derivatives, such as grain size, impedance and volume heterogeneity were more important to model performance than AR derivatives mean, skewness, and kurtosis. Additionally, this study investigated the impact of segmentation software settings when creating segmented surfaces and their impact on overall model accuracy. We found using fine scale segmentation resulted in the best model performance. These results indicate the importance of incorporating backscatter derivatives into biological habitat maps and the need to consider scale to increase the accuracy of the outputs to help improve the spatial management of marine environments.
1 Introduction
Coastal regions support a wide range of human activity, such as commercial and recreational fisheries, aquaculture, and resource extraction. These anthropogenic pressures often result in threats to the local biodiversity and ecosystems. To successfully protect and conserve marine areas, more information on geological and ecological characteristics are required (Brown et al., 2011). The production of habitat maps is a key decision-support tool for conservation management and planning (Costello, 2009) but requires detailed information regarding the physical characteristics of the seafloor. Many studies have shown the utility in data from multibeam echosounders (MBES), including both bathymetry and backscatter, for producing accurate and useful habitat maps (Lecours et al., 2017; Lacharité et al., 2018; Fakiris et al., 2019).
Bathymetry provides information that has long been used to delineate habitats due to its correlation with light attenuation, which influences the distribution of habitat forming algal species and their associated communities (Kendal et al., 2005; Ready et al., 2010; Rees et al., 2014; MacDonald et al., 2016; Sen et al., 2016). Derivatives from bathymetry, such as geomorphological complexity, rugosity and slope, have also contributed to understanding the distributions of sessile invertebrate (Kendal et al., 2005), and macroalgal assemblages (Toohey et al., 2007). In addition to the bathymetry information provided by MBES systems, backscatter, which is the intensity of the acoustic signal return used to infer seafloor geological and biological characteristics, is also acquired and can be converted into continuous mosaics.
Characterising the seafloor using backscatter requires more parameters compared to bathymetric measurements, most importantly target strength, and incident angle (Lurton et al., 2015). Target strength is a description of how much acoustic energy is redirected or scattered back to the echosounder with rough surfaces scattering a greater portion of the acoustic signal back to the receiver compared to smooth surfaces, which scatter much less signal. The backscatter intensity is also impacted by the incidence angle, with increasingly weaker returns as the incidence angle increases (Lurton et al., 2015).
Previous studies have shown the usefulness of backscatter derived mosaics for classifying biological communities such as rhodolith and seagrass beds through unsupervised clustering (Ryan et al., 2007; Hamilton and Parnum, 2011). However, to create a backscatter mosaic, the angular response must be removed, resulting in omission of useful data. Angular backscatter intensity, or backscatter angular response (AR), can be processed (or extracted) to investigate in detail the backscatter intensity as a function of incidence angle, scattered from the seafloor surfaces (Lurton et al., 2015) under the assumption of a homogenous seabed. From the backscatter response curve further variables such as the mean, slope, kurtosis and skewness of the curves can be derived and used as variables for the classification process as in Che Hasan et al. (2012). Combining bathymetric and backscatter AR derivatives often results in more accurate habitat classifications, compared to bathymetric derivatives alone (Che Hasan et al., 2012; Sen et al., 2016) and the inclusion of AR derivatives with bathymetry and backscatter derivatives can increase overall map accuracy up to 5% according to previous studies (Che Hasan et al., 2012, 2014; Fakiris et al., 2019).
The above process differs from angular range analysis (ARA) approach, which uses a geo-acoustic inversion model to predict sediment classes (Fonseca and Mayer, 2007). ARA attempts to use the angular backscatter intensity information to estimate type of sediment as well as other sediment properties, such as the sediment grain size, index of impedance and volume heterogeneity (Mulhearn, 2000; Fonseca et al., 2009). These inversion parameters are useful for identifying differences in the seafloor that can be attributed to variations in features and biological habitats (Brown and Blondel, 2009; Che Hasan et al., 2014; Lecours et al., 2016a). However, there are no studies that assess the importance of combined AR and ARA mosaics on classification accuracy.
Incorporating AR derivatives (mean, slope, kurtosis, and skewness) and ARA inversion parameters (sediment grain size, index of impedance, and volume heterogeneity) in a classification with high resolution bathymetry and backscatter mosaics is challenging due to the mismatch of spatial resolution (Fonseca et al., 2009; Che Hasan et al., 2012). Both AR and ARA are “half-swath time-series” data that require uninterrupted time-series for the port and starboard swaths, with swath width increasing as depth increases (Schimel et al., 2018). Considering this requirement, one assumption when processing AR and ARA is that the seafloor is homogenous at the scale of the swath and areas where the seafloor is heterogeneous results in less reliable outputs (Clarke et al., 1997; Fonseca et al., 2009; Che Hasan et al., 2012). Additionally, the resulting derivative mosaics, such as grain size, are spatially limited to the cross track length of the port, and starboard swaths (Fonseca et al., 2009). Although challenging to incorporate into habitat classifiers, adding AR and ARA into benthic habitat classification has been shown to improve classification prediction accuracy despite the cost of coarser spatial resolution (Clarke, 1994; Clarke et al., 1997; Lamarche et al., 2011; Che Hasan et al., 2012).
ARA is limited if substrate properties change part way across the swath and as a result is difficult to integrate into high resolution habitat maps. One promising method for incorporating AR derivatives and ARA inversion parameters into higher resolution habitat maps is by extracting this information from homogeneous regions or segments. The goal of segmentation is to separate the study area into multiple varying sized objects based on spectral and spatial characteristics (Diesing et al., 2014). This process can be achieved by performing spatial segmentation of the corrected bathymetric (spatial) and backscatter (spectral) mosaics. Using segmented polygons created from the bathymetric and backscatter surfaces to create segmented mosaics of ARA curves identifies spatial differences in seafloor properties that may be difficult to derive from the ARA curves alone. Image segmentation has the added benefit of reducing the impact of MBES backscatter artefacts on model predictions by smoothing outliers present in the mosaic within homogeneous objects (Lecours et al., 2017).
Artefacts in MBES bathymetry and backscatter datasets are common, and may result from MBES installation, sea state, and user input. These artefacts can be further reduced at the pixel level by varying the analytical scale (kernel size) when generating derivative surfaces. By increasing the analytical scale, artefacts are smoothed due to the influence of nearby records (MacMillan and Shary, 2009). In addition to reducing artefacts within a MBES dataset, analytical scale can have an impact on model performance as demonstrated by Wilson et al. (2007) who found that a single fixed analytical scale cannot capture all features of interest and as a result may impact model performance. Including derivatives at multiple analytical scales has been demonstrated to increase model performance (Wilson et al., 2007; Porskamp et al., 2018). Using multiple analytical scales allows for the derivative surfaces that best capture the variability in the environment to be used in classifying predetermined habitat classes (Wilson et al., 2007).
We explore methods for including multibeam bathymetry and backscatter derivatives, ARA inversion parameters and AR derivatives, using image segmentation along with multiscale environmental derivatives as variables in a Random Forest (RF) classifier. For each classification hierarchy explored in this study we evaluate:
1) How the inclusion of ARA inversion parameters and AR derivatives influences habitat classification models by assessing variable importance through mean decrease in accuracy, and
2) How image segmentation approaches influence overall model accuracies at varying scales.
Ultimately, this study aims to determine the most effective methods for accurately classifying marine habitats to aid in marine spatial management, including the management of marine protected areas.
2 Methodology
2.1 Study Site
The study site is located at Wilsons Promontory Marine National Park (MNP) in the temperate coastal zone of Victoria, south-eastern Australia (Figure 1). Wilsons Promontory Marine National Park was designated in 2002 and is the largest marine national park in Victoria. Recreational fishing, commercial fishing, or any activities that disturb the seafloor are not permitted within the park. It is classified under the International Union for Conservation of Nature and Natural Resources (IUCN) category II, which means it protects a functioning ecosystem, and supports education and recreation.
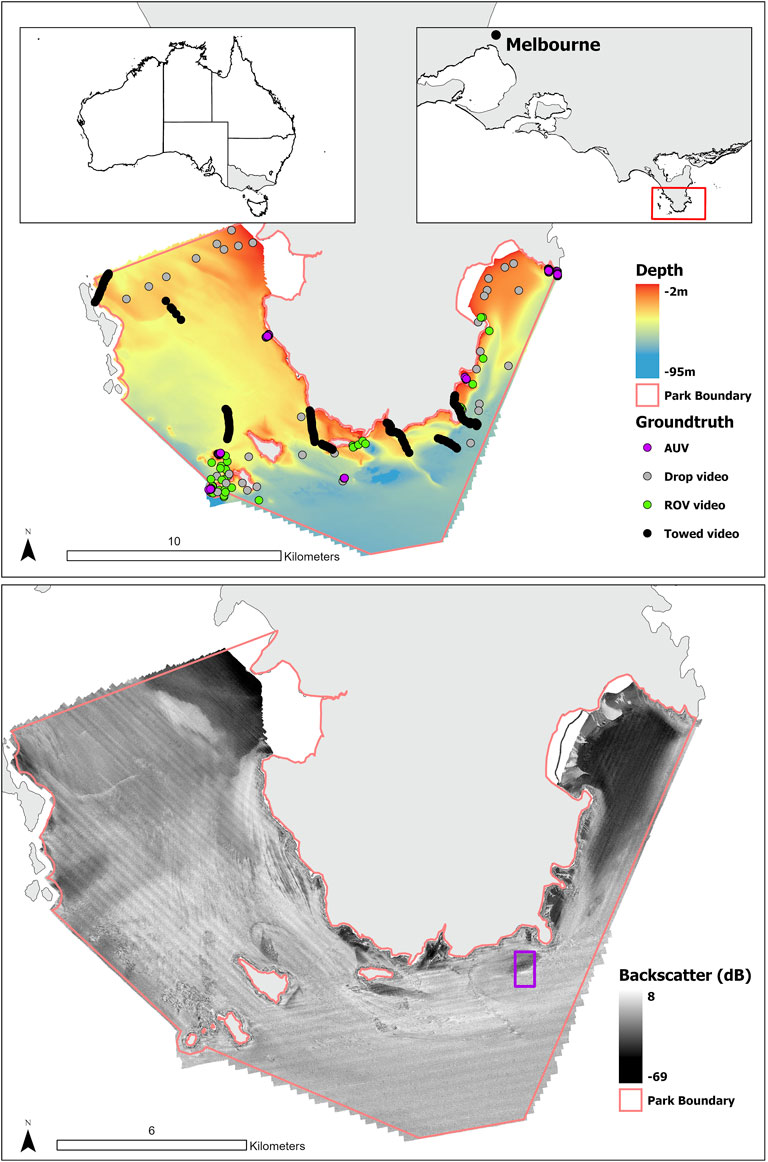
FIGURE 1. Map of Wilsons Promontory Marine National Park bathymetry coverage, Victoria, Australia. Video groundtruthing sites are plotted, with gray representing drop video samples, green ROV samples, purple representing AUV samples and black towed video samples. The purple box represents the extents from Figures 4, 5.
The Park is characterised by a coastal granitic reef with areas of complex sand dunes further from shore. In addition, there are several deep (up to 90 m) nearshore scoured depressions. Wilson’s Promontory MNP supports high biodiversity (Edmunds et al., 2012) with 180 fish, 404 molluscs, 191 crustaceans, and 1,633 plants/algae species (Parks, 2017). Biodiversity is likely high due to the seasonal convergence of the East Australian and South Australian currents (Kennedy et al., 2014). High energy shallow rocky reefs are dominated by fucoid macroalgae, primarily Phyllospora comosa. Deeper reefs to the south of the park are largely dominated by sessile invertebrate communities.
2.2 MBES Collection and Processing
Bathymetry and backscatter were collected using a multibeam echosounder (Kongsberg EM 2040C) aboard the research vessel MV Yolla at a frequency of 300 kHz with an automated ping and fixed pulse rate dependent on survey conditions. Differential GPS positions were post-processed using POSPac MMS. Bathymetry data were processed with CARIS HIPS and SIPS (v8.1A). The backscatter mosaic was processed with FMGT (v.7.4.1) to correct for source level, absorption and spreading losses, and insonified areas. To remove the angular effect, we used a trend Angular Varying Gain (AVG) correction using angular interval of 20
2.3 Segmentation
Image segmentation partitions the surface into continuous regions that share similar attributes (Blaschke, 2010). Our study used ENVI FX (ENVI, 2020) to perform Image segmentation on the FMGT (FMGT, 2020) backscatter mosaic and CARIS (CARIS, 2017) bathymetry digital elevation model (DEM). ENVI FX uses a hybrid segmentation method that combines region-growing and edge-based methods (Chen et al., 2018). The scale parameter is defined as the percentage of the normalized cumulative distribution of the pixel values in the gradient or intensity image (Kucharczyk et al., 2020). For example, a scale parameter of 10 indicates that the region growing would start with the lowest 10 percent of pixel values, essentially a minimum parameter for initial regions. After the initial regions are created, adjacent regions are merged based on their similarity of brightness, texture and colour. Selection of scale parameters were guided by previous studies that used image segmentation for benthic habitat map segmentation (Adger, 1997). To determine if scale selection in image segmentation influences overall model accuracy, our study used a scale parameter of 15 (fine scale: 4,531 objects), 30 (medium scale: 2,586) and 45 (broad scale: 1,608 objects).
2.4 AR and ARA Creation
To prepare for AR derivatives, first, the raw backscatter *.all files were processed using CMST-GA MB Process v17.05.07 (Gavrilov and Parsons, 2014) which converted the raw backscatter valuesto backscatter intensity values presented as a function of incidence angle (i.e. angular response) in MATLAB format over 5 consecutive pings. Secondly, a custom MATLAB script (v2018b) (Che Hasan et al., 2014) was used to extract the AR derivatives mean, slope, kurtosis and skewness for each segmented polygon, as discussed above. This tool outputs each AR derivative as a mosaic, which were gridded at a resolution of 1 m.
ARA curves were calculated and corrected using FMGT and converted into continuous raster mosaics, as a function of incident angle over five consecutive pings, with the port and starboard curves calculated separately. The study area ranges in depth from 2 to 90 m, using 5 pings and resulting in a footprint of 1.85 m for the deepest areas of the park and 0.5 m in the shallowest areas of the park. A geophysical model (Jackson et al., 1986) is fitted to these curves in FMGT, which produces estimates of the following parameters impedance, grain size, and volume heterogeneity (Fonseca et al., 2002; Fonseca and Mayer, 2007). Impedance is defined as the ratio between acoustic pressure and the velocity of the soundwave, indicating “hardness” of the seafloor (Fonseca et al., 2009; Hou et al., 2018) and grain size represents sediment grain size measured in millimetres (Manik and Jaya, 2016). As the present study did not extend to sediment analysis, raw grain size values are used as a relative comparison between grain sizes. Volume heterogeneity provides information on density and porosity of the sediment (Jackson and Briggs, 1992). To reduce the impact of “swath resolution” and possible artefacts from sediment type changing mid swath, the ARA derivatives central tendencies (mean, and standard deviation) were calculated for each segment. All output raster mosaics were re-gridded at a scale of 1 m to match all derivatives. A summary of all derivatives can be found in Table 1. One limitation to the ARA approach is that the models are for unconsolidated sediments. Therefore, impedance and grain size for gravel and rock come out as the same from the ARA inversion. As a result, sites with large areas of bedrock or gravel may find ARA derivatives grain size, impedance and volume less important in the RF model. The Jackson model (Jackson et al., 1986) specifies that the classifications are only applicable for sonar systems between 10 and 100 kHz; however, previous studies have shown (Jackson and Ivakin, 1998) that roughness and volume parameters essentially have no frequency dependence. Due to the limitations of this method and our lack of sediment samples at this site, which would be necessary to groundtruth classifications, we used ARA as a measure of relative grain size and the heterogeneity of the sediment. These parameters are helpful when defining biological habitat.
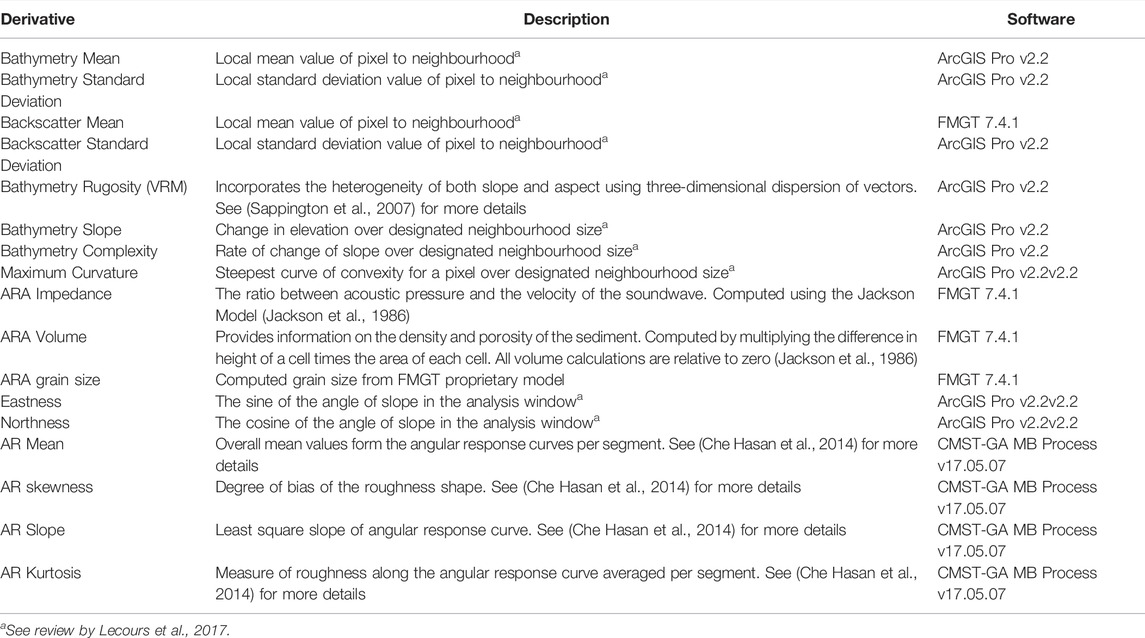
TABLE 1. List of bathymetry and backscatter derivatives and their respective equations.
2.5 Groundtruth Collection and Classification
We compiled all available seabed observations across the park to inform the habitat mapping process. Video observations were collected between 2013 and 2016: 85 drop video samples collected in 2014, 41 ROV video samples collected in 2013, 7 AUV flights collected in 2016 and 7 towed video transects collected in 2016. Video was classified using the Combined Biotope Classification Scheme (CBiCS) (Edmunds and Flynn, 2015), which has been adopted by the Victorian Department of Environment, Land, Water and Planning. Video observations were classified into categories according to six of the CBiCS hierarchical levels. Three hierarchical levels of the scheme; broad habitat classes (BC2), habitat complexes (BC3), and biotope complexes (BC4) were used in the present study (Table 2). In order to limit spatial autocorrelation in the groundtruth data, each groundtruth source was split into point observations (i.e., continuous towed video transects were separated into points, each with latitude, longitude and class). Variograms for each CBiCS class were created in R v3.6.1 following methods by Lyons et al., 2018 to determine the minimum distance between all points to reduce spatial autocorrelation. The groundtruth dataset was then stratified by class and randomly subset with a minimum distance of 35 m to reduce the spatial autocorrelation. To limit the impact of rare classes on model accuracy any classes with less than 25 observations were excluded (Table 2).
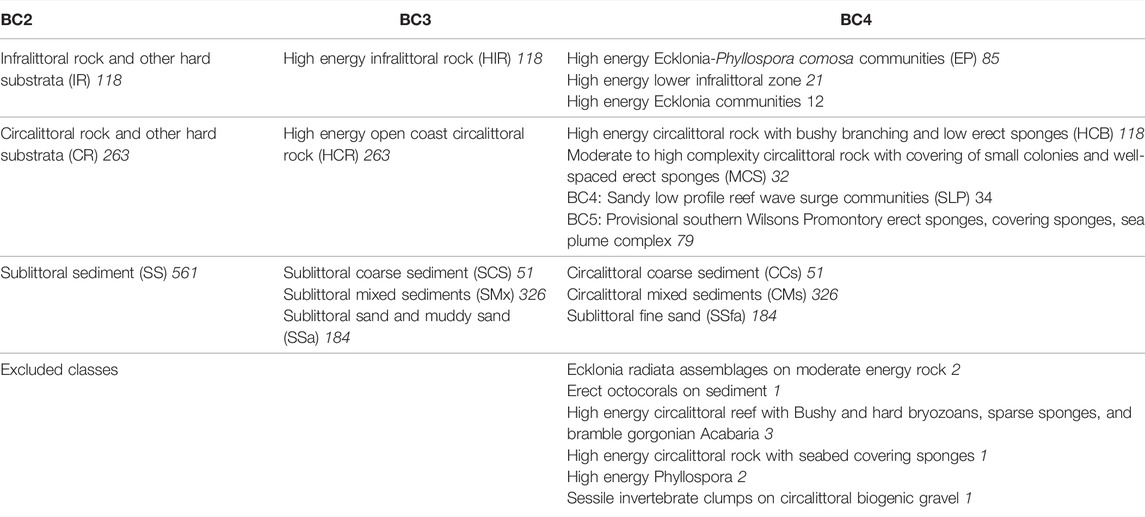
TABLE 2. Combined Biotope Classification Scheme (CBiCS) hierarchies (BC2, BC3, BC4) used to train and validate the three hierarchical models in the present study. Number of observed classes from groundtruth data (italicized) for each level class.
2.6 Statistical Approaches
2.6.1 Modeling
A random forests (RF) approach was used to derive rule-based relationships between geophysical derivatives and observational data using the “randomForest” package in R (Liaw and Wiener, 2002). The RF classification approach reduces overfitting by including the results of multiple trees from iterative bootstrap samples (Cutler et al., 2007). RF reduces bias via random selection of variables. Stephens and Diesing (2014) show that tree-based methods, particularly RF, resulted in more accurate classifications than competing methods when predicting sediment classes. For a workflow flowchart see Figure 2.
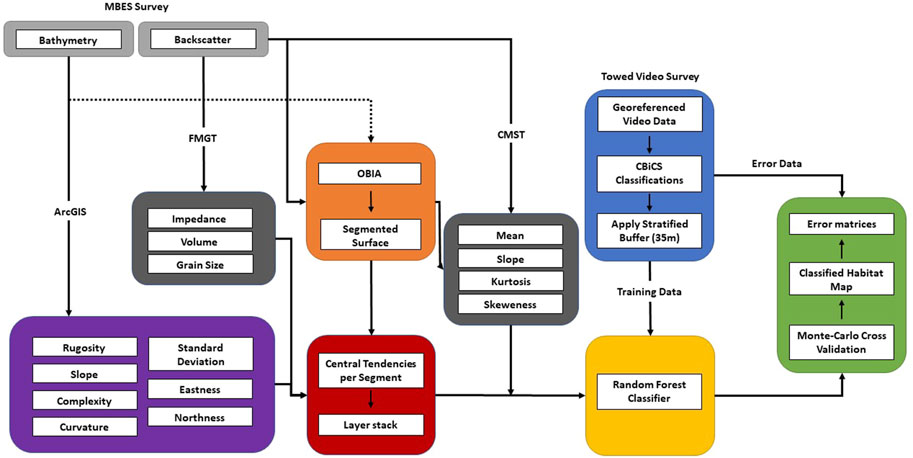
FIGURE 2. Flowchart depicting analysis options for Bathymetry, backscatter AR and ARA.
Model parameters mtry (i.e., amount of variables to sample at each split) and ntree (i.e., number of trees, aiming for the minimum number to stabilize the error) were determined using model optimization procedures in the ‘caret’ package from R (Kuhn, 2020), and set to 11 and 300 respectively for all fine segmentation models. Variable importance for each RF model was determined by using mean decrease in accuracy. Mean decrease in accuracy is calculated by using the out-of-bag error (prediction error utilizing bootstrap aggregating) for each tree for each variable. The differences between each variable are then averaged over all trees (Han et al., 2016). The higher the mean decrease in accuracy the more important the variable is to the model. Many studies demonstrate the benefits of permutating variable importance, however these studies are typically focused on the field of genomics; running simulated studies with as little as 5 predictor variables that are highly correlated, and primarily categorical (Strobl et al., 2007; Nicodemus et al., 2010). Running high dimensional (162 variables) large observational (708) models over multiple permutations is computationally intensive (Degenhardt et al., 2017), therefore we did not average variable importance over multiple permutations. Predictors from this study were assessed using Pearson product-moment correlation (Figure 3). Any predictor variables with a correlation value greater than 0.8 or smaller than 0.8 were assessed by variable importance, with the lowest ranking variable being removed, reducing the correlation below the threshold for the retained variable (retained variables are shown in Table 3). Correlated variables within the model can lead to large variances when small changes within the collated variables occur, which is why it is best practice to remove correlated variables (Ohlemüller et al., 2008). For more details on variable importance refer to Porskamp et al., 2018. The same predictor variables were selected for the three segmentation sizes, broad, medium and fine, to allow comparisons across segmentation scales.
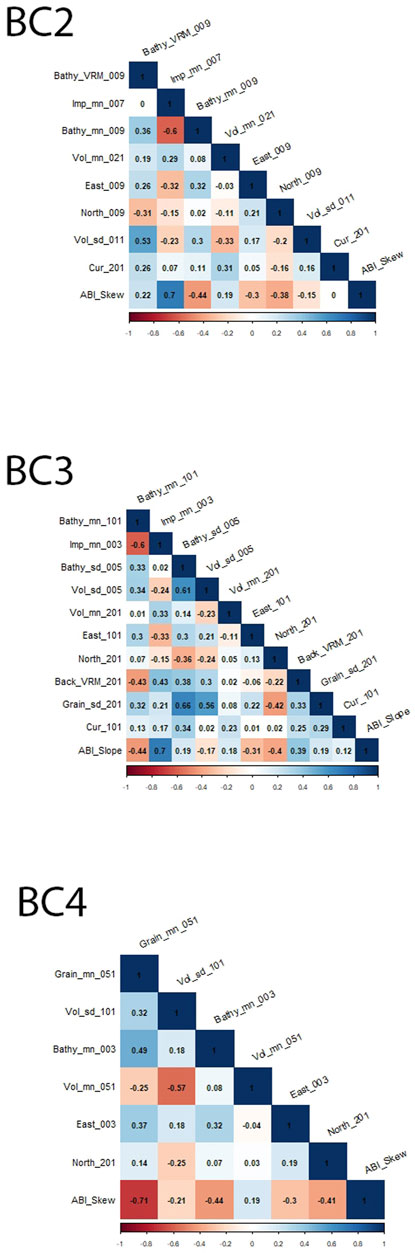
FIGURE 3. Pearson product-moment correlation plots for fine segmentation. See variable code names in Table 3.
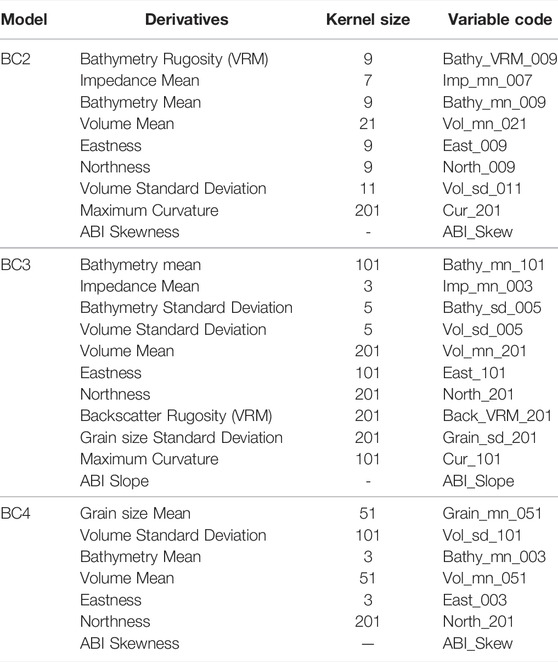
TABLE 3. Model predictors and spatial scale retained for fine segmentation.
2.6.2 Predictive Mapping
Classified habitat maps were created using the “ModelMap” package in R (Freeman and Frescino, 2009). Model accuracies were determined following Lyons et al. (2018) methods, which randomly splits groundtruth data into training and validation samples. This process is repeated 500 times and the mean and variance of the error metrics are used as an indication of map confidence.
2.6.3 One-Way ANOVA
To determine differences between image segmentation scales, overall model accuracies were used. For each image segmentation scale, RF models were run 500 times, each time with a different training and validation dataset for a total of 1,500 overall accuracies. This resulted in three groups, fine, medium and broad, each with 500 overall accuracy values. To test if there was a significant difference between the three groups, we applied a one-way analysis of variance (ANOVA) with an α value of 0.05.
3 Results
3.1 Image Segmentation Results
Overall, the three image segmentations createsimilar objects within the backscatter mosaic (Figure 4). Comparing the three different segmentation scales, broad medium and fine, reveals that overall model accuracy is within 1% of each scale (Table 4). The overall accuracy medians for BC3 and BC4 were approximately 10% less than BC2. Standard deviation is low across the tested segmentations. There was a significant difference between model means as determined by one-way ANOVA (F (2, 1,497) = 17.21, p < 0.001).
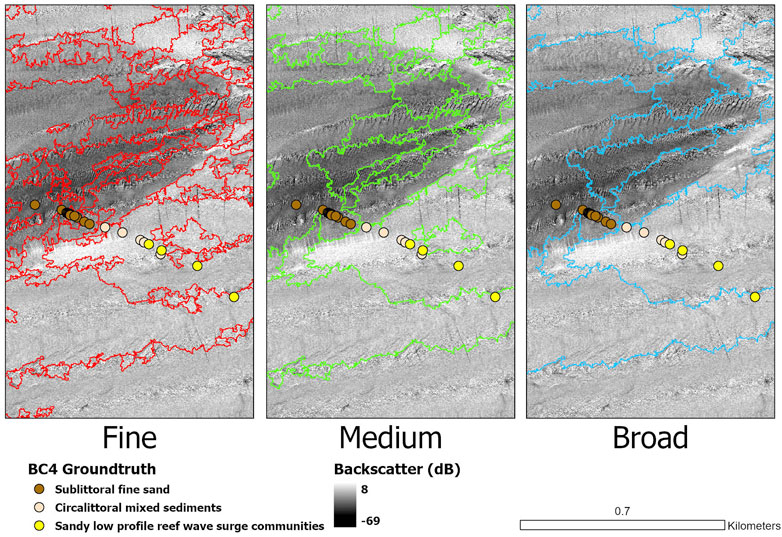
FIGURE 4. Image segmentation examples showing differences between fine (4,531) medium (2,486) and broad (1,608) over the backscatter mosaic. The CBiCS classification from the biotope complex (BC4) classification is also included as categorized points to show how the different backscatter intensities reflect the differences in those classes over sediment habitats.
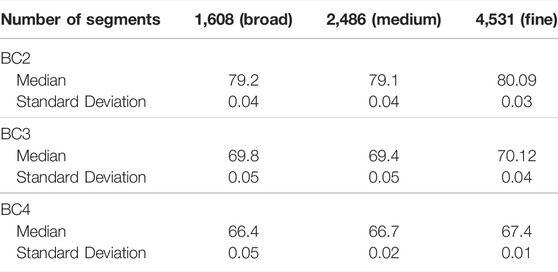
TABLE 4. Overall mean and standard deviations for the three segment sizes tested.
3.2 ARA Derivative Results
Most of the site was circalittoral fine sand at the BC4 level followed by sandy low-profile reef wave surge communities. Example outputs form continuous unsegmented ARA derivatives; impedance, volume, and grain size (Figure 5).
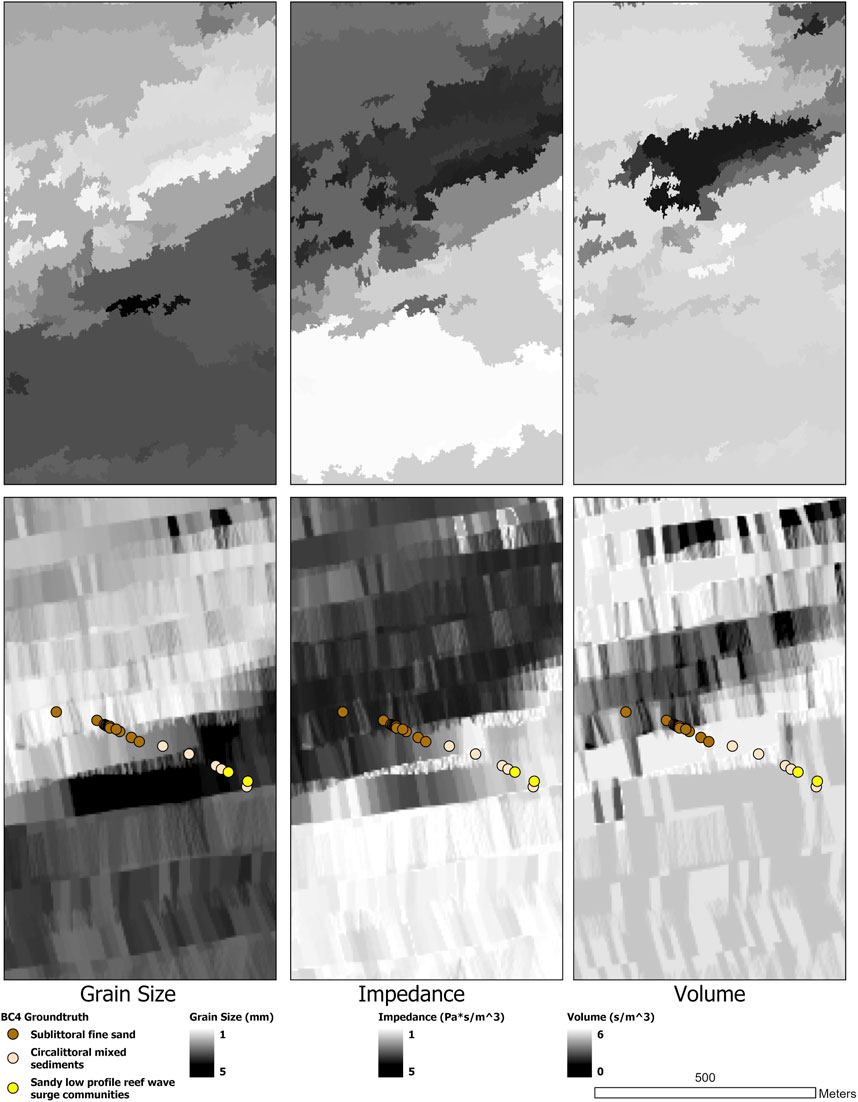
FIGURE 5. Example surfaces for the ARA derivatives Grain size, Impedance, and Volume with groundtruth points coloured by category. Top row are ARA derivatives post segmentation, bottom row are ARA derivatives pre segmentation.
To demonstrate class separability, mean angular response curves were generated for BC2, and BC4 based on groundtruth observations (Figure 6). A figure was not generated for BC3 because the curves were similar to BC2. Both circalittoral rock (CR) and infralittoral rock (IR) BC2 classes have similar angular response curves with CR slightly higher than IR (Figure 6A). The differences between CR and IR decrease as incidence angle increases. Differences between these two classes could be driven by depth differences between the two classes. Sublittoral sediment (SS) shows good separation from both IR and CR as it starts the highest dB value and ends at the lowest for the three classes (Figure 6A).
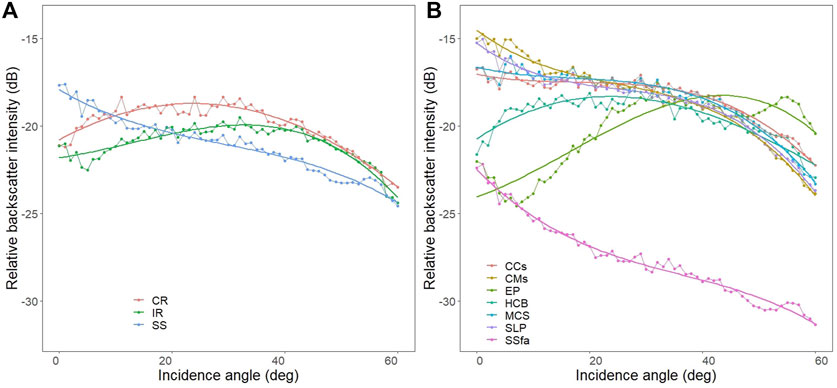
FIGURE 6. Mean angular response curves from groundtruth observations for BC2 classes (A) and BC4 classes (B). See Table 2 for full class names.
Sublittoral fine sand (SSfa) BC4 class was the most different of the seven classes starting lower than all classes with a fairly consistent drop off for both near and outer incidence angles (Figure 6B). High energy Ecklonia-Phyllospora comosa communities (EP) shows the strongest discrimination characteristic from 0 to 30°. Although Ecklonia-Phyllospora comosa communities are found on consolidated substrate, the presence of dense algae could be a possible cause for near beams (0–30°) to have such low intensities. Circalittoral mixed sediments (CMs), circalittoral coarse sediments (CCS), moderate to high complexity circalittoral rock with covering of small colonies and well-spaced erect sponges (MCS) and sandy low profile reef wave surge communities (SLP) show the most separation between 0 and 15° with the outer beams having similar intensities (Figure 6B). High energy circalittoral rock with bushy branching and low erect sponges (HCB) has the strongest discrimination in the near beams (0–20°). BC2 classes were more disguisable than BC4 classes, which is likely due to BC2 class separation focused on substratum while BC4 classes are separated by biological communities.
3.3 Habitat Classification Maps
The habitat classification map for BC2 shows that “sublittoral sediments” dominate the Wilsons Promontory site, while “circalittoral rock” and “infralittoral rock” are found fringing along the granitic headlands and islands (Figure 7). The BC3 classification map is similar to BC2, but the sublittoral sediment classes are further split into “sublittoral mixed sediments” and “sublittoral sand and muddy sand”.
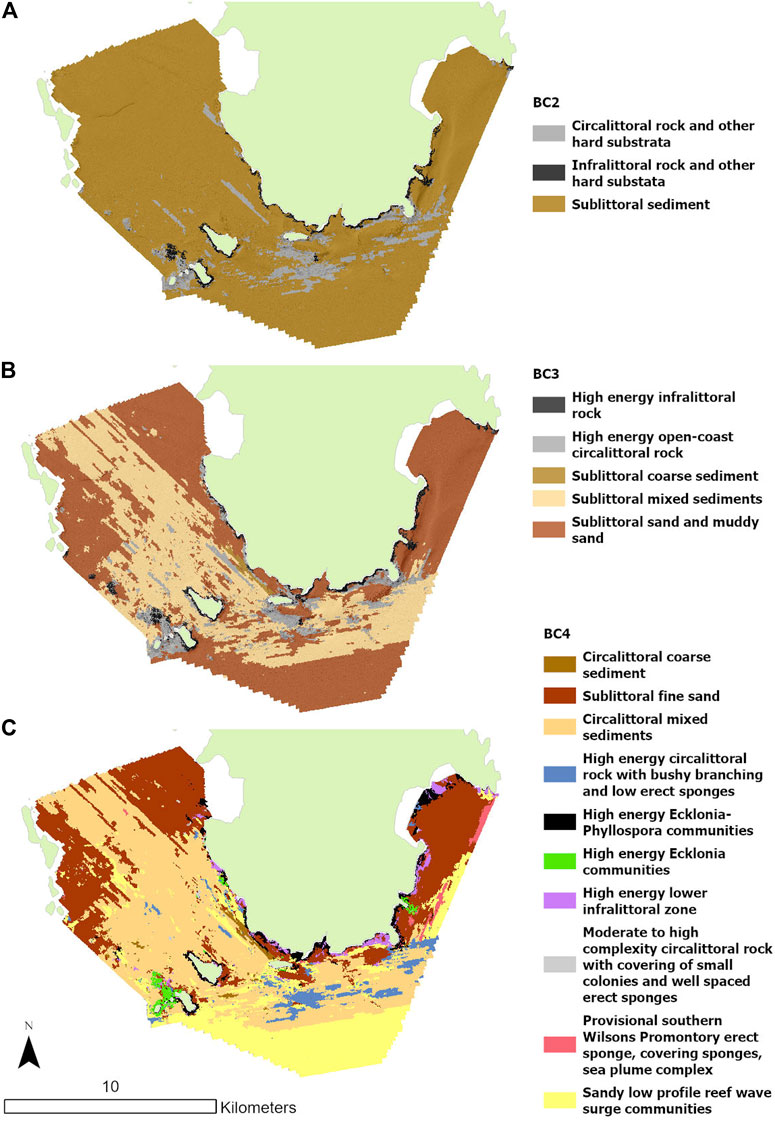
FIGURE 7. Habitat classification maps across CBiCS hierarchies for fine segmentation. (A) habitat map for BC2, (B) habitat map for BC3, (C) habitat map for BC4. Created using ModelMap in R. Fine image segmentation used for final habitat maps.
The smallest class by area for BC4 was “circalittoral coarse sediment”, found in the southwestern section of the study site at a mean depth of 45 ± 9 m. The next smallest class by area is “moderate to high complexity circalittoral rock with covering of small colonies and well-spaced erect sponges” and is found primarily in the west near shore with a mean depth of 45 ± 7 m “Circalittoral fine sand” is the largest class by area and is distributed primarily in the east and south of the site with patches in the west. “Circalittoral fine sand” has a mean depth of 44 ± 7 m. The next largest class by area is “circalittoral mixed sediments”, which are found deeper than “circalittoral fine sand” with a mean of 49 ± 8 m “Circalittoral mixed sediments” are found throughout the western section of Wilsons Promontory with patches near the headlands in the south. The biotope complex “high energy circalittoral rock with bushy branching and low erect sponges” are found at a mean depth of 58 ± 14 m with the majority located just south of the headlands. “High energy Ecklonia-Phyllospora communities” are present along the coastline and fringing off the Southwestern Islands at a mean depth of 27 ± 8 m. The final class, “sandy low-profile reef wave surge communities”, is scattered within “circalittoral mixed sediments” with a mean depth of 48 ± 9 m. Overall model accuracies and class accuracies for BC2, BC3 and BC4 can be found in Supplementary Tables S1, S2, S3 respectively.
3.4 Variable Importance Comparisons
Variable importance plots for the fine scale segmentation model are shown in Figure 8. Bathymetry VRM exhibited the greatest mean decrease in accuracy for hierarchy BC2, while Bathymetry mean, and grain size mean were greatest for BC3 and BC4 respectively. The ARA derivatives volume, impedance and grain size had consistently higher mean decrease in accuracy values over other variables, such as backscatter mean, backscatter standard deviation, slope, and curvature. The AR derivative skewness was ranked lowest for hierarchy BC2 and BC4, while AR slope ranked lowest for BC3.
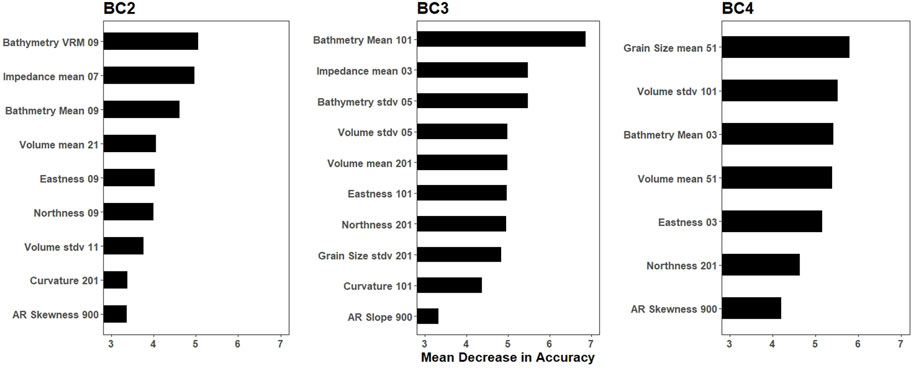
FIGURE 8. Retained model variable importance for fine-scale segmentation. The higher mean decrease accuracy the more important the variable is for the model.
For medium scale segmentation, impedance mean exhibited the greatest mean decrease in accuracy for hierarchy BC2 and BC3, and grain size mean was greatest for BC4 (Figure 9). The ARA derivatives volume, impedance and grain size had consistently higher mean decrease in accuracy values over other variables, such as backscatter mean, backscatter standard deviation, slope, curvature, eastness and northness. The AR derivative kurtosis was ranked lowest for hierarchy BC3, while curvature was ranked lowest for BC2 and BC4 (Figure 9).
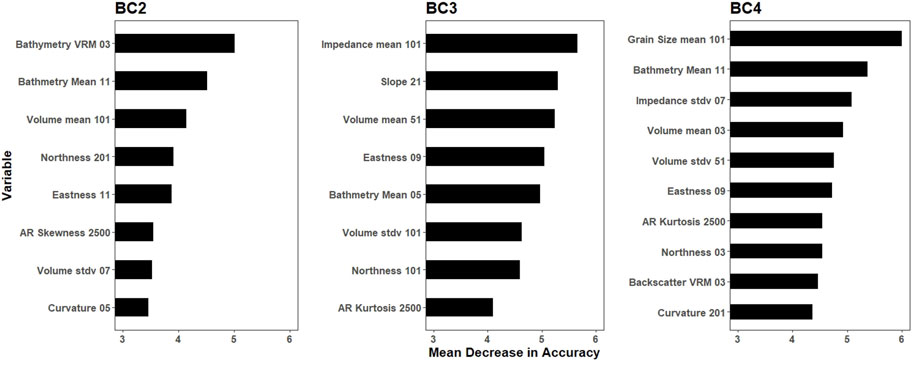
FIGURE 9. Retained model variable importance for medium scale segmentation. The higher mean decrease accuracy the more important the variable is for the model.
For broad scale segmentation bathymetry mean exhibited the greatest mean decrease in accuracy for hierarchy BC2 and BC4, and complexity was greatest for BC3 (Figure 10). Unlike the fine and medium scale segmentation models impedance and grain size mean had lower importance than broad scale segmentation models. The AR derivative kurtosis was ranked lowest for hierarchy BC3, while curvature was ranked lowest for BC2. The lowest ranking derivative for BC4 was AR slope.
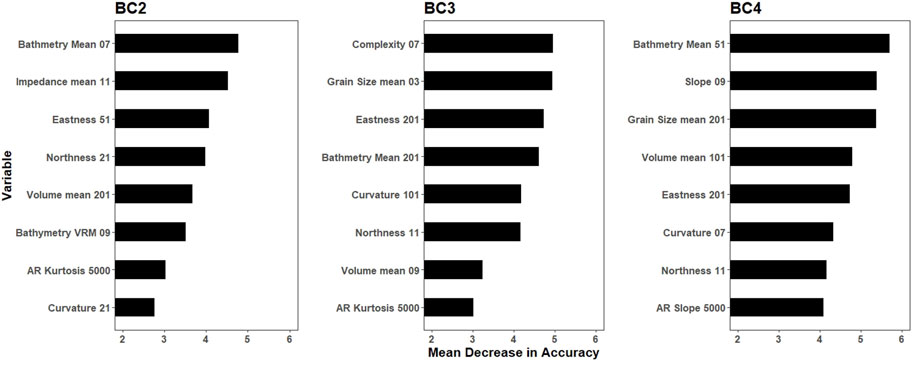
FIGURE 10. Retained model variables for broad scale segmentation. The higher mean decrease accuracy the more important the variable is for the model.
4 Discussion
Benthic habitat mapping provides important decision-support tools for spatial management of marine resources and associated species diversity. Quantifying and improving map accuracy increases certainty for decision makers. Compared to terrestrial studies, marine studies are often limited in the information available to classify habitats, which has, in part, driven the development of new technologies and methods used to improve accuracy of habitat classification (Fakiris et al., 2019). This study builds on previous work conducted by Che Hasan et al., 2014; Fonseca et al. (2009) and is the first to include ARA derivatives grain size, impedance and volume with contemporary environmental variables into a RF model to classify biotic communities. These combinations of variables were incorporated into nine RF models to classify habitats at three hierarchical scales: broad habitats, habitat complexes and biotic complexes, and using three levels of segmentation. The results of this study directly compare the importance of environmental variables that best describe habitat distribution within Wilsons Promontory Marine National Park. Additionally, this study demonstrated that methods for creating segmented surfaces using image segmentation affect overall model accuracy, indicating the importance of testing and developing methods for optimising the number of segments that produce the most accurate habitat classification maps.
4.1 Impact of Variables
Across the models, ARA derivatives ranked high for variable importance, whereas AR derivatives ranked lowest for six of the nine models. The inversion parameters from ARA, volume heterogeneity, grain size, and impedance were more important to all nine models than values from backscatter mean, backscatter standard deviation and backscatter VRM. In some cases, backscatter derivatives and ARA inversion parameters were correlated with one another, but in all cases the ARA derivatives were more important. These results support the hypothesis by Fonseca et al. (2009), which found that ARA inversion parameters modelled from MBES observation correlated well with substrate photos and would likely aid in discrimination and delineation of benthic habitat maps.
The utility of both ARA inversion parameters and AR derivatives at Wilsons Promontory is probably due to the dominance of sediment classes at this site. ARA and AR derivatives are particularly good at separating sediment classes (Hamilton and Parnum, 2011; Rzhanov et al., 2012; Huang et al., 2013; Zhi et al., 2014; Daniell et al., 2015; Siwabessy et al., 2017). This ability to delineate sediment using ARA derivative properties likely resulted in the higher ranking of ARA derivatives. Previous studies have explored how ARA derivatives impact model performance through separating geological classes (Fonseca et al., 2009; Rzhanov et al., 2012) as well as AR derivatives (Huang et al., 2013; Che Hasan et al., 2014; Daniell et al., 2015; Siwabessy et al., 2017) but none have compared variable importance between both methods of including angular response data.
Each of the ARA derivatives, grain size, impedance, and volume heterogeneity, had varying effects on the classifications across the hierarchical scheme. These ARA derivatives have had limited application in habitat classification studies due to difficulty incorporating with high resolution bathymetry and backscatter datasets because of the mismatch in spatial resolution (Fonseca et al., 2009; Che Hasan et al., 2012). To incorporate ARA derivatives with contemporary environmental variables, the derivatives must be segmented, which may reduce the overall resolution of the habitat classification map. However, these derivatives describe and delineate sediment physically (Fonseca et al., 2009; Hamilton and Parnum, 2011; Rzhanov et al., 2012; Che Hasan et al., 2014) and because sediment influences the distribution of biotic communities (Ryan et al., 2007; McBreen et al., 2008), could explain why grain size, impedance and volume rank highly among the biological classification scheme. Relative grain size was a variable of high importance for both the BC3 and BC4 classifications, probably due to grain size often driving the distribution of those biotic communities associated with sediment (Seiderer and Newell, 1999; McBreen et al., 2008). Grain size is also the primary factor used in the hierarchy to define the classes in the groundtruthing datasets—so this would be expected. Impedance is found to be influential in delineating classes in BC2 and BC3, which are primarily defined by geological features, such as sediment versus rock. Although ranked lower than impedance and grain size, volume mean, and volume standard deviation are present in each model and in each hierarchy. Fonseca et al. (2009) hypothesized that volume homogeneity would be useful for delineation of benthic habitat maps and our study supports this hypothesis. Volume is a measure of sediment “heterogeneity” and is an important variable for identifying changes in sediment types (Fonseca et al., 2009).
ARA derivatives outranked many contemporary environmental variables such as slope, eastness, northness, complexity, backscatter and, most notably, bathymetry. Slope, eastness, northness, and complexity represent various degrees of complexity in the seafloor (Lecours et al., 2016b). Wilson’s Promontory has low variability in the seafloor for the majority of the site with areas of high complexity associated with the extension of granitic headlands, outcrops and high current areas where sediment waves were observed only making up a small area of the park (see Kennedy et al., 2014). The lower coverage of high complexity substrates likely caused the lower importance of those variables associated with complexity compared to ARA derivatives. Previous studies that use MBES data to classify seafloor habitat have typically found bathymetry (depth) to be the highest ranking variable in terms of importance (Che Hasan et al., 2014; Rattray et al., 2015; Lecours et al., 2016a; Ierodiaconou et al., 2018). Since our site is dominated by granitic reefs it is important to note that the transition of the granitic reefs is relatively steep and can cause issues with lack of observations across the depth range. In this study ARA derivatives grain size and impedance contributed to differentiating the classes specified, resulting in high mean decrease in accuracy values. A possible explanation for ARA derivatives’ high importance is likely due to Wilsons Promontory being dominated by sediment communities (91% coverage) with fringing “reef” based communities covering the remaining area (9% coverage). CBiCS reef-based classes are frequently delineated by the macroalgae and sessile invertebrate communities with their distributions influenced by the amount of light they receive, unlike sediment-based classes. Daniell et al. (2015) demonstrated that AR curves can be used to identify hard, soft and, most relevant to benthic habitat delineation, mixed substrate types. To determine ARA’s effectiveness at delineating mixed substrate types and reef communities’ future studies should explore ARA derivatives importance at sites with higher diversity of reef-based communities.
4.2 Hierarchical Comparison
As the number of classes increases among the hierarchy, overall model accuracy decreases, which has been previously demonstrated using RF models (Bernard et al., 2009; Wilson et al., 2007; Porskamp et al., 2018). As the hierarchy becomes more complex (increased number of classes) more rare classes with fewer observations are included that reduce the ability of the models to accurately predict rare classes (Hernandez et al., 2006). To reduce this effect, we excluded any classes with less than 25 observations. A reduction in model accuracy with the introduction or rare classes is a limitation observed in other classification schemes such as EUNIS (Galparsoro et al., 2012). The roughly 10% drop in accuracy from BC2 to BC3 was much larger than BC3 to BC4 (3%) and is likely due to class delineation in BC2 driven primarily by geologic features and the fewer number of classes in BC2. Both BC3 and BC4 have multiple classes over the same substrate type, and therefore have closer overall accuracies. One method to reduce the impact of classes with few observations influencing overall model accuracy at each hierarchy is planning groundtruthing surveys to focus on capturing as many biotic communities as possible through more representative and balanced sampling to reduce the number of repetitions over the same substrate type (Daniell et al., 2015; Foster et al., 2018). However, even better planned groundtruthing surveys may not capture truly rare classes that have a small spatial footprint resulting in these classes being excluded from the classification. Often, we are in a position where groundtruthing is combined from several different sources, basically discovery surveys rather than part of a long-term monitoring program. Removing rare classes that are a key interest for management bodies is not an ideal solution, however there are alternative statistical methods for including rare classes such as using a balanced random forest design (Chen et al., 2004; Diesing, 2020) or by using a Synthetic Minority Over-sampling Technique (Chawla et al., 2002). These methods should be explored in future studies to increase the ability to retain rare classes in random forest models. Products used in the classification process are useful in informing future sampling strategies such as spatially balanced designs. Additionally, future studies should investigate using a nested approach when modeling across multiple hierarchies to preserve shared classifications across models.
4.3 Segmentation Comparison
When comparing model accuracies across the various segmentation sizes, there was a significant difference between fine, medium, and broad image segmentation scales. Previous studies have noted differences in model performance between segmentation software and methods (Chen, 2008; Clinton et al., 2010; Montereale Gavazzi et al., 2016; Liu et al., 2017) but did not test scale effects within the same software and their impact on model performance. When extracting features using image segmentation software, in our case ENVI, care should be taken in the selection of merging and edge detecting values as they can affect the overall model accuracy. This study found that using a low merge value (e.g., fine segmentation) resulted in the best overall model accuracy (Table 4). Due to the size of Wilsons Promontory, we were limited in how many segments could be created and processed in a reasonable time. Although our results were statistically significant, a 1% difference between segmentation scales may not be warranted for all future studies. Future research should test additional merge settings to determine at what merge settings model accuracy is highest and beyond which accuracies do not improve. Segmentation scale is likely driven by site characteristics and thus should be tested whenever using an image segmentation approach. One limitation with using the fine segmentation as opposed to medium and broad is that along track artefacts in the outer beams from the backscatter mosaic are detected by the software. These artefacts are therefore visible in the final habitat map as elongated spatial habitat distributions. These artefacts in the backscatter mosaic persists after radiometric and geometric corrections are applied and is therefore likely they are from data acquisition. When acquiring MBES data careful selection of time varied gain, swath width, and pulse type can reduce the number of artefacts visible in a backscatter mosaic but is not always possible to survey constraints such as weather conditions and strict timelines or the prioritisation of bathymetry data over backscatter in the settings used.
5 Conclusion
Overall, this study shows how AR and ARA can be included in predictive habitat mapping when using an image segmentation approach and RF classifier. If the study site is dominated by sediments, including ARA derivatives will potentially improve model performance, resulting in more accurate habitat classification maps. These methods can be applied to any site with bathymetry, backscatter and groundtruth data. This study is a quantitative representation of angular response derivatives, future work should investigate incorporating absolute grain size measurements. Lastly, this study found that image segmentation merge settings affect overall classification accuracy. When applying image segmentation to create segmented surfaces finding the best performing segmented surface should be a priority.
Data Availability Statement
Publicly available datasets were analyzed in this study. This data can be found here: mapshare.vic.gov.au/coastkit/.
Author Contributions
DI conceived the project and led the fieldwork. PP led the analyses and writing with contributions from DI, MY, AR, CB and RC.
Funding
This work was supported by the Parks Victoria Research Partners Panel Program- Baseline habitat mapping and improved monitoring of reef habitats in Victoria’s marine national parks and sanctuaries. Towed video was classified by Australian Marine Ecology and Fathom Pacific using CBiCS under a project funded by the Department of Environment, Land, Water, and Planning for the development of a hierarchical classification scheme for marine environments in Victoria. GIS laboratory facilities at Deakin University, Warrnambool Campus, Victoria were used for spatial analyses. Autonomous Underwater Vehicle data was sourced from Australia’s Integrated Marine Observing System (IMOS) ‐ IMOS is enabled by the National Collaborative Research Infrastructure Strategy (NCRIS).
Conflict of Interest
The authors declare that the research was conducted in the absence of any commercial or financial relationships that could be construed as a potential conflict of interest.
Publisher’s Note
All claims expressed in this article are solely those of the authors and do not necessarily represent those of their affiliated organizations, or those of the publisher, the editors and the reviewers. Any product that may be evaluated in this article, or claim that may be made by its manufacturer, is not guaranteed or endorsed by the publisher.
Supplementary Material
The Supplementary Material for this article can be found online at: https://www.frontiersin.org/articles/10.3389/frsen.2022.903133/full#supplementary-material
References
Adger, W. N. (1997). Sustainability and Social Resilience in Coastal Resource Use. Norwich: Citeseer.
ArcGIS (2020). Environmental Systems Research Institute. Redlands, CA: (ESRI). Available at: https://www.esri.com/en-us/arcgis/products/arcgis-pro/overview.
Blaschke, T. (2010). Object Based Image Analysis for Remote Sensing. ISPRS J. Photogrammetry Remote Sens. 65, 2–16. doi:10.1016/j.isprsjprs.2009.06.004
Brown, C. J., and Blondel, P. (2009). Developments in the Application of Multibeam Sonar Backscatter for Seafloor Habitat Mapping. Appl. Acoust. 70, 1242–1247. doi:10.1016/j.apacoust.2008.08.004
Brown, C. J., Smith, S. J., Lawton, P., and Anderson, J. T. (2011). Benthic Habitat Mapping: A Review of Progress towards Improved Understanding of the Spatial Ecology of the Seafloor Using Acoustic Techniques. Estuar. Coast. Shelf Sci. 92, 502–520. doi:10.1016/j.ecss.2011.02.007
CARIS (2017). Teledyne. Available at: https://www.teledynecaris.com/en/home/.
Chawla, N. V., Bowyer, K. W., Hall, L. O., and Kegelmeyer, W. P. (2002). SMOTE: Synthetic Minority Over-sampling Technique. jair 16, 321–357. doi:10.1613/jair.953
Che Hasan, R., Ierodiaconou, D., and Laurenson, L. (2012). Combining Angular Response Classification and Backscatter Imagery Segmentation for Benthic Biological Habitat Mapping. Estuar. Coast. Shelf Sci. 97, 1–9. doi:10.1016/j.ecss.2011.10.004
Che Hasan, R., Ierodiaconou, D., Laurenson, L., and Schimel, A. (2014). Integrating Multibeam Backscatter Angular Response, Mosaic and Bathymetry Data for Benthic Habitat Mapping. PLoS ONE 9, e97339. doi:10.1371/journal.pone.0097339
Chen, C., Liaw, A., and Breiman, L. (2004). Using Random Forest to Learn Imbalanced Data, 110. Berkeley: University of California, 24.
Chen, G., Weng, Q., Hay, G. J., and He, Y. (2018). Geographic Object-Based Image Analysis (GEOBIA): Emerging Trends and Future Opportunities. GIScience Remote Sens. 55, 159–182. doi:10.1080/15481603.2018.1426092
Chen, L. (2008). Lambda-Connectedness Determination for Image Segmentation. arXiv:0803.2363 [cs]. Available at: http://arxiv.org/abs/0803.2363 (Accessed January 9, 2020).
Clarke, J. E. H., Danforth, B. W., and Valentine, P. (1997). “Areal Seabed Classification Using Backscatter Angular Response at 95 kHz,” in SACLANTCEN Conf On High Frequency Acoustics In Shallow Water, 243–250. Available at: http://www.omg.unb.ca/orig/omg/papers/HFSW_1997_Lerici.pdf (Accessed September 8, 2017).
Clinton, N., Holt, A., Scarborough, J., Yan, L., and Gong, P. (2010). Accuracy Assessment Measures for Object-Based Image Segmentation Goodness. Photogramm. Eng. remote Sens. 76, 289–299. doi:10.14358/PERS.76.3.289
Costello, M. (2009). Distinguishing Marine Habitat Classification Concepts for Ecological Data Management. Mar. Ecol. Prog. Ser. 397, 253–268. doi:10.3354/meps08317
Cutler, D. R., Edwards, T. C., Beard, K. H., Cutler, A., Hess, K. T., Gibson, J., et al. (2007). Random Forests for Classification in Ecology. Ecology 88, 2783–2792. doi:10.1890/07-0539.1
Daniell, J., Siwabessy, J., Nichol, S., and Brooke, B. (2015). Insights into Environmental Drivers of Acoustic Angular Response Using a Self-Organising Map and Hierarchical Clustering. Geo-Mar Lett. 35, 387–403. doi:10.1007/s00367-015-0415-5
Degenhardt, F., Seifert, S., and Szymczak, S. (2017). Evaluation of Variable Selection Methods for Random Forests and Omics Data Sets. Briefings Bioinforma. 20, 492–503. doi:10.1093/bib/bbx124
Diesing, M. (2020). Deep-sea Sediments of the Global Ocean. Earth Syst. Sci. Data 12, 3367–3381. doi:10.5194/essd-12-3367-2020
Diesing, M., Green, S. L., Stephens, D., Lark, R. M., Stewart, H. A., and Dove, D. (2014). Mapping Seabed Sediments: Comparison of Manual, Geostatistical, Object-Based Image Analysis and Machine Learning Approaches. Cont. Shelf Res. 84, 107–119. doi:10.1016/j.csr.2014.05.004
Edmunds, M., and Flynn, A. (2015). A Victorian Marine Biotope Classification Scheme. Melbourne, Vic.
Edmunds, M. J., Pritchard, K., and Davis, S. (2012). Victorian Subtidal Reef Monitoring Program: The Reef Biota at Wilsons Promontory Marine National Park, December 2011. Parks Victoria.
ENVI (2020). Segmentation Algorithms Background. Available at: https://www.l3harrisgeospatial.com/docs/backgroundsegmentationalgorithm.html (Accessed December 8, 2020).
Fakiris, E., Blondel, P., Papatheodorou, G., Christodoulou, D., Dimas, X., Georgiou, N., et al. (2019). Multi-Frequency, Multi-Sonar Mapping of Shallow Habitats-Efficacy and Management Implications in the National Marine Park of Zakynthos, Greece. Remote Sens. 11, 461. doi:10.3390/rs11040461
FMGT (2020). QPS. Available at: https://confluence.qps.nl/fledermaus7/reference-manual/fmgt.
Fonseca, L., Brown, C., Calder, B., Mayer, L., and Rzhanov, Y. (2009). Angular Range Analysis of Acoustic Themes from Stanton Banks Ireland: A Link between Visual Interpretation and Multibeam Echosounder Angular Signatures. Appl. Acoust. 70, 1298–1304. doi:10.1016/j.apacoust.2008.09.008
Fonseca, L., Mayer, L., Orange, D., and Driscoll, N. (2002). The High-Frequency Backscattering Angular Response of Gassy Sediments: Model/data Comparison from the Eel River Margin, California. J. Acoust. Soc. Am. 111, 2621–2631. doi:10.1121/1.1471911
Fonseca, L., and Mayer, L. (2007). Remote Estimation of Surficial Seafloor Properties through the Application Angular Range Analysis to Multibeam Sonar Data. Mar. Geophys Res. 28, 119–126. doi:10.1007/s11001-007-9019-4
Freeman, E., and Frescino, T. (2009). ModelMap: Modeling and Map Production Using Random Forest and Stochastic Gradient Boosting. 25th street. Ogden, UT, USA: USDA Forest Service, Rocky Mountain Research Station, 507.
Galparsoro, I., Connor, D. W., Borja, Á., Aish, A., Amorim, P., Bajjouk, T., et al. (2012). Using EUNIS Habitat Classification for Benthic Mapping in European Seas: Present Concerns and Future Needs. Mar. Pollut. Bull. 64, 2630–2638. doi:10.1016/j.marpolbul.2012.10.010
Gavrilov, A., and Parsons, M. (2014). A Matlab Tool for the Characterisation of Recorded Underwater Sound (CHORUS). Acoust. Aust. 42, 190–196. Available at: https://espace.curtin.edu.au/handle/20.500.11937/38736
Hamilton, L. J., and Parnum, I. (2011). Acoustic Seabed Segmentation from Direct Statistical Clustering of Entire Multibeam Sonar Backscatter Curves. Cont. Shelf Res. 31, 138–148. doi:10.1016/j.csr.2010.12.002
Han, H., Guo, X., and Yu, H. (2016). “Variable Selection Using Mean Decrease Accuracy and Mean Decrease Gini Based on Random Forest,” in 2016 7th Ieee International Conference on Software Engineering and Service Science (Icsess) (IEEE), 219–224. doi:10.1109/icsess.2016.7883053
Hou, Z., Chen, Z., Wang, J., Zheng, X., Yan, W., Tian, Y., et al. (2018). Acoustic Impedance Properties of Seafloor Sediments off the Coast of Southeastern Hainan, South China Sea. J. Asian Earth Sci. 154, 1–7. doi:10.1016/j.jseaes.2017.12.003
Huang, Z., Siwabessy, J., Nichol, S., Anderson, T., and Brooke, B. (2013). Predictive Mapping of Seabed Cover Types Using Angular Response Curves of Multibeam Backscatter Data: Testing Different Feature Analysis Approaches. Cont. Shelf Res. 61-62, 12–22. doi:10.1016/j.csr.2013.04.024
Hughes Clarke, J. (1994). Toward Remote Seafloor Classification Using the Angular Response of Acoustic Backscattering: a Case Study from Multiple Overlapping GLORIA Data. IEEE J. Ocean. Eng. 19, 112–127. doi:10.1109/48.289456
Ierodiaconou, D., Schimel, A. C. G., Kennedy, D., Monk, J., Gaylard, G., Young, M., et al. (2018). Combining Pixel and Object Based Image Analysis of Ultra-high Resolution Multibeam Bathymetry and Backscatter for Habitat Mapping in Shallow Marine Waters. Mar. Geophys Res. 39, 271–288. doi:10.1007/s11001-017-9338-z
Jackson, D. R., and Briggs, K. B. (1992). High‐frequency Bottom Backscattering: Roughness versus Sediment Volume Scattering. J. Acoust. Soc. Am. 92, 962–977. doi:10.1121/1.403966
Jackson, D. R., and Ivakin, A. N. (1998). Scattering from Elastic Sea Beds: First-Order Theory. J. Acoust. Soc. Am. 103, 336–345. doi:10.1121/1.421093
Jackson, D. R., Winebrenner, D. P., and Ishimaru, A. (1986). Application of the Composite Roughness Model to High‐frequency Bottom Backscattering. J. Acoust. Soc. Am. 79, 1410–1422. doi:10.1121/1.393669
Kendall, M. S., Jensen, O. P., Alexander, C., Field, D., McFall, G., Bohne, R., et al. (2005). Benthic Mapping Using Sonar, Video Transects, and an Innovative Approach to Accuracy Assessment: A Characterization of Bottom Features in the Georgia Bight. J. Coast. Res. 216, 1154–1165. doi:10.2112/03-0101r.1
Kennedy, D. M., Ierodiaconou, D., and Schimel, A. (2014). Granitic Coastal Geomorphology: Applying Integrated Terrestrial and Bathymetric LiDAR with Multibeam Sonar to Examine Coastal Landscape Evolution. Earth Surf. Process. Landforms 39, 1663–1674. doi:10.1002/esp.3615
Kucharczyk, M., Hay, G. J., Ghaffarian, S., and Hugenholtz, C. H. (2020). Geographic Object-Based Image Analysis: A Primer and Future Directions. Remote Sens. 12, 2012. doi:10.3390/rs12122012
Kuhn, M. (2020). Caret: Classification and Regression Training. Available at: https://CRAN.R-project.org/package=caret.
Lacharité, M., Brown, C. J., and Gazzola, V. (2018). Multisource Multibeam Backscatter Data: Developing a Strategy for the Production of Benthic Habitat Maps Using Semi-automated Seafloor Classification Methods. Mar. Geophys. Res. 39, 307–322. doi:10.1007/s11001-017-9331-6
Lamarche, G., Lurton, X., Verdier, A.-L., and Augustin, J.-M. (2011). Quantitative Characterisation of Seafloor Substrate and Bedforms Using Advanced Processing of Multibeam Backscatter-Application to Cook Strait, New Zealand. Cont. Shelf Res. 31, S93–S109. doi:10.1016/j.csr.2010.06.001
Lecours, V., Brown, C. J., Devillers, R., Lucieer, V. L., and Edinger, E. N. (2016a). Comparing Selections of Environmental Variables for Ecological Studies: A Focus on Terrain Attributes. PLOS ONE 11, e0167128. doi:10.1371/journal.pone.0167128
Lecours, V., Devillers, R., Edinger, E. N., Brown, C. J., and Lucieer, V. L. (2017). Influence of Artefacts in Marine Digital Terrain Models on Habitat Maps and Species Distribution Models: a Multiscale Assessment. Remote Sens. Ecol. Conserv. 3, 232–246. doi:10.1002/rse2.49
Lecours, V., Dolan, M. F. J., Micallef, A., and Lucieer, V. L. (2016b). A Review of Marine Geomorphometry, the Quantitative Study of the Seafloor. Hydrol. Earth Syst. Sci. 20, 3207–3244. doi:10.5194/hess-20-3207-2016
Liaw, A., and Wiener, M. (2002). Classification and Regression by randomForest. R. News 2, 18–22. Available at: https://cogns.northwestern.edu/cbmg/LiawAndWiener2002.pdf
Liu, X., Xu, J.-W., Zhao, J.-F., Wu, A.-D., Ke, J.-H., Liu, X., et al. (2017). The Comparison of Segmentation Results for UAV High-Resolution Remote Sensing Image Among eCognition, ENVI and EDISON. dtssehs 42, 1439–1446. doi:10.12783/dtssehs/icss2016/9201
Lurton, X., Lamarche, G., Brown, C., Lucieer, V. L., Rice, G., Schimel, A., et al. (2015). Backscatter Measurements by Seafloor-Mapping Sonars: Guidelines and Recommendations. A Collect. Rep. by members GeoHab Backscatter Work. Group, 1–200. Available at: https://niwa.co.nz/static/BWSG_REPORT_MAY2015_web.pdf
Lyons, M. B., Keith, D. A., Phinn, S. R., Mason, T. J., and Elith, J. (2018). A Comparison of Resampling Methods for Remote Sensing Classification and Accuracy Assessment. Remote Sens. Environ. 208, 145–153. doi:10.1016/j.rse.2018.02.026
MacDonald, C., Bridge, T., and Jones, G. (2016). Depth, Bay Position and Habitat Structure as Determinants of Coral Reef Fish Distributions: Are Deep Reefs a Potential Refuge? Mar. Ecol. Prog. Ser. 561, 217–231. doi:10.3354/meps11953
MacMillan, R. A., and Shary, P. A. (2009). “Chapter 9 Landforms and Landform Elements in Geomorphometry,” in Developments in Soil Science (Elsevier), 227–254. doi:10.1016/S0166-2481(08)00009-3
Manik, H. M., and Jaya, I. (2016). Angular Range Analysis (ARA) and K-Means Clustering of Multibeam Echosounder Data for Determining Sediment Type. ILMU Kelaut.21, 177–184.
McBreen, F., Wilson, J. G., Mackie, A. S. Y., and Nic Aonghusa, C. (2008). “Seabed Mapping in the Southern Irish Sea: Predicting Benthic Biological Communities Based on Sediment Characteristics,” in Challenges to Marine Ecosystems (Springer), 93–103. doi:10.1007/s10750-008-9341-0
Montereale Gavazzi, G., Madricardo, F., Janowski, L., Kruss, A., Blondel, P., Sigovini, M., et al. (2016). Evaluation of Seabed Mapping Methods for Fine-Scale Classification of Extremely Shallow Benthic Habitats - Application to the Venice Lagoon, Italy. Estuar. Coast. Shelf Sci. 170, 45–60. doi:10.1016/j.ecss.2015.12.014
Mulhearn, P. J. (2000). Modelling Acoustic Backscatter from Near-Normal Incidence Echosounders : Sensitivity Analysis of the Jackson Model. Melbourne, Australia: Defence Science And Technology Organisation Melbourne. Australia.
Nicodemus, K. K., Malley, J. D., Strobl, C., and Ziegler, A. (2010). The Behaviour of Random Forest Permutation-Based Variable Importance Measures under Predictor Correlation. BMC Bioinforma. 11, 110–113. doi:10.1186/1471-2105-11-110
Ohlemüller, R., Anderson, B. J., Araújo, M. B., Butchart, S. H., Kudrna, O., Ridgely, R. S., et al. (2008). The Coincidence of Climatic and Species Rarity: High Risk to Small-Range Species from Climate Change. Biol. Lett. 4, 568–572. doi:10.1098/rsbl.2008.0097
Porskamp, P., Rattray, A., Young, M., and Ierodiaconou, D. (2018). Multiscale and Hierarchical Classification for Benthic Habitat Mapping. Geosciences 8, 119. doi:10.3390/geosciences8040119
Rattray, A., Ierodiaconou, D., and Womersley, T. (2015). Wave Exposure as a Predictor of Benthic Habitat Distribution on High Energy Temperate Reefs. Front. Mar. Sci. 2. doi:10.3389/fmars.2015.00008
Ready, J., Kaschner, K., South, A. B., Eastwood, P. D., Rees, T., Rius, J., et al. (2010). Predicting the Distributions of Marine Organisms at the Global Scale. Ecol. Model. 221, 467–478. doi:10.1016/j.ecolmodel.2009.10.025
Rees, M. J., Jordan, A., Price, O. F., Coleman, M. A., and Davis, A. R. (2014). Abiotic Surrogates for Temperate Rocky Reef Biodiversity: Implications for Marine Protected Areas. Divers. Distrib. 20, 284–296. doi:10.1111/ddi.12134
Ryan, D. A., Brooke, B. P., Collins, L. B., Kendrick, G. A., Baxter, K. J., Bickers, A. N., et al. (2007). The Influence of Geomorphology and Sedimentary Processes on Shallow-Water Benthic Habitat Distribution: Esperance Bay, Western Australia. Estuar. Coast. Shelf Sci. 72, 379–386. doi:10.1016/j.ecss.2006.10.008
Rzhanov, Y., Fonseca, L., and Mayer, L. (2012). Construction of Seafloor Thematic Maps from Multibeam Acoustic Backscatter Angular Response Data. Comput. Geosciences 41, 181–187. doi:10.1016/j.cageo.2011.09.001
Sappington, J. M., Longshore, K. M., and Thompson, D. B. (2007). Quantifying Landscape Ruggedness for Animal Habitat Analysis: A Case Study Using Bighorn Sheep in the Mojave Desert. J. Wildl. Manag. 71, 1419–1426. doi:10.2193/2005-723
Schimel, A. C. G., Beaudoin, J., Parnum, I. M., Le Bas, T., Schmidt, V., Keith, G., et al. (2018). Multibeam Sonar Backscatter Data Processing. Mar. Geophys Res. 39, 121–137. doi:10.1007/s11001-018-9341-z
Seiderer, L., and Newell, R. (1999). Analysis of the Relationship between Sediment Composition and Benthic Community Structure in Coastal Deposits: Implications for Marine Aggregate Dredging. ICES J. Mar. Sci. 56, 757–765. doi:10.1006/jmsc.1999.0495
Sen, A., Ondréas, H., Gaillot, A., Marcon, Y., Augustin, J.-M., and Olu, K. (2016). The Use of Multibeam Backscatter and Bathymetry as a Means of Identifying Faunal Assemblages in a Deep-Sea Cold Seep. Deep Sea Res. Part I Oceanogr. Res. Pap. 110, 33–49. doi:10.1016/j.dsr.2016.01.005
Siwabessy, P. J. W., Tran, M., Picard, K., Brooke, B. P., Huang, Z., Smit, N., et al. (2017). Modelling the Distribution of Hard Seabed Using Calibrated Multibeam Acoustic Backscatter Data in a Tropical, Macrotidal Embayment: Darwin Harbour, Australia. Mar. Geophys Res. 39, 249–269. doi:10.1007/s11001-017-9314-7
Stephens, D., and Diesing, M. (2014). A Comparison of Supervised Classification Methods for the Prediction of Substrate Type Using Multibeam Acoustic and Legacy Grain-Size Data. PLoS ONE 9, e93950. doi:10.1371/journal.pone.0093950
Strobl, C., Boulesteix, A. L., Zeileis, A., and Hothorn, T. (2007). Bias in Random Forest Variable Importance Measures: Illustrations, Sources and a Solution. BMC Bioinforma. 8, 25–21. doi:10.1186/1471-2105-8-25
Toohey, B. D., Kendrick, G. A., and Harvey, E. S. (2007). Disturbance and Reef Topography Maintain High Local Diversity inEcklonia Radiatakelp Forests. Oikos 116, 1618–1630. doi:10.1111/j.0030-1299.2007.15689.x
Wilson, M. F. J., O’Connell, B., Brown, C., Guinan, J. C., and Grehan, A. J. (2007). Multiscale Terrain Analysis of Multibeam Bathymetry Data for Habitat Mapping on the Continental Slope. Mar. Geod. 30, 3–35. doi:10.1080/01490410701295962
Keywords: backscatter, angular range analysis, habitat maps, multiscale analysis, image segementation, hierachical classification scheme, bathymetry, multibeam
Citation: Porskamp P, Young M, Rattray A, Brown CJ, Hasan RC and Ierodiaconou D (2022) Integrating Angular Backscatter Response Analysis Derivatives Into a Hierarchical Classification for Habitat Mapping. Front. Remote Sens. 3:903133. doi: 10.3389/frsen.2022.903133
Received: 23 March 2022; Accepted: 26 April 2022;
Published: 31 May 2022.
Edited by:
DelWayne Roger Bohnenstiehl, North Carolina State University, United StatesReviewed by:
Markus Diesing, Geological Survey of Norway, NorwayElias Fakiris, University of Patras, Greece
Copyright © 2022 Porskamp, Young, Rattray, Brown, Hasan and Ierodiaconou. This is an open-access article distributed under the terms of the Creative Commons Attribution License (CC BY). The use, distribution or reproduction in other forums is permitted, provided the original author(s) and the copyright owner(s) are credited and that the original publication in this journal is cited, in accordance with accepted academic practice. No use, distribution or reproduction is permitted which does not comply with these terms.
*Correspondence: Peter Porskamp, p.porskamp@deakin.edu.au