Drone-based water sampling and characterization of three freshwater harmful algal blooms in the United States
 Regina Hanlon1
  Stephen J. Jacquemin2
  Johnna A. Birbeck3 Judy A. Westrick3 Charbel Harb4 Hope Gruszewski1
  Andrew P. Ault5
  Durelle Scott6
  Hosein Foroutan4
  Shane D. Ross7 Javier González-Rocha7,8
  Craig Powers1,4 Lowell Pratt8
  Harry Looney8 Greg Baker8
  David G. Schmale1*
- 1School of Plant and Environmental Sciences, Virginia Tech, Blacksburg, VA, United States
- 2Lake Campus, Wright State University, Celina, OH, United States
- 3Lumigen Instrument Center, Wayne State University, Detroit, MI, United States
- 4Civil and Environmental Engineering, Virginia Tech, Blacksburg, VA, United States
- 5Department of Chemistry, University of Michigan, Ann Arbor, MI, United States
- 6Biological Systems Engineering, Virginia Tech, Blacksburg, VA, United States
- 7Aerospace and Ocean Engineering, Virginia Tech, Blacksburg, VA, United States
- 8Lake Anna Civic Association, Mineral, VA, United States
Freshwater harmful algal blooms (HABs), caused mostly by toxic cyanobacteria, produce a range of cyanotoxins that threaten the health of humans and domestic animals. Climate conditions and anthropogenic influences such as agricultural run-off can alter the onset and intensity of HABs. Little is known about the distribution and spread of freshwater HABs. Current sampling protocols in some lakes involve teams of researchers that collect samples by hand from a boat and/or from the shoreline. Water samples can be collected from the surface, from discrete-depth collections, and/or from depth-integrated intervals. These collections are often restricted to certain months of the year, and generally are only performed at a limited number of collection sites. In lakes with active HABs, surface samples are generally sufficient for HAB water quality assessments. We used a unique DrOne Water Sampling SystEm (DOWSE) to collect water samples from the surface of three different HABs in Ohio (Grand Lake St Marys, GLSM and Lake Erie) and Virginia (Lake Anna), United States in 2019. The DOWSE consisted of a 3D-printed sampling device tethered to a drone (uncrewed aerial system, or UAS), and was used to collect surface water samples at different distances (10–100 m) from the shore or from an anchored boat. One hundred and eighty water samples (40 at GLSM, 20 at Lake Erie, and 120 at Lake Anna) were collected and analyzed from 18 drone flights. Our methods included testing for cyanotoxins, phycocyanin, and nutrients from surface water samples. Mean concentrations of microcystins (MCs) in drone water samples were 15.00, 1.92, and 0.02 ppb for GLSM, Lake Erie, and Lake Anna, respectively. Lake Anna had low levels of anatoxin in nearly all (111/120) of the drone water samples. Mean concentrations of phycocyanin in drone water samples were 687, 38, and 62 ppb for GLSM, Lake Erie, and Lake Anna, respectively. High levels of total phosphorus were observed in the drone water samples from GLSM (mean of 0.34 mg/L) and Lake Erie (mean of 0.12 mg/L). Lake Anna had the highest variability of total phosphorus with concentrations that ranged from 0.01 mg/L to 0.21 mg/L, with a mean of 0.06 mg/L. Nitrate levels varied greatly across sites, inverse with bloom biomass, ranging from below detection to 3.64 mg/L, with highest mean values in Lake Erie followed by GLSM and Lake Anna, respectively. Drones offer a rapid, targeted collection of water samples from virtually anywhere on a lake with an active HAB without the need for a boat which can disturb the surrounding water. Drones are, however, limited in their ability to operate during inclement weather such as rain and heavy winds. Collectively, our results highlight numerous opportunities for drone-based water sampling technologies to track, predict, and respond to HABs in the future.
Introduction
Harmful algal blooms (HABs), caused mostly by toxic cyanobacteria, have been observed around the world (Anderson et al., 2002). Different HAB-associated cyanobacteria produce a range of toxins called cyanotoxins that impact human health, including microcystins (MCs), saxitoxin (STX), anatoxin-a (ANA), and cylindrospermopsin (CYN) (Zurawell et al., 2005; Du et al., 2019; Ballot et al., 2020). HABs appear to be increasing in prevalence and severity around the world (Anderson et al., 2002; Schmale et al., 2019; Wells et al., 2020), and new information is necessary to understand the fate and transport of HABs and their associated toxins (Stumpf et al., 2016; Topp et al., 2020; Ross et al., 2022). Research is needed to understand threats, manage risks, mitigate incidents, develop capabilities, and strengthen collaborations for water quality (Topp et al., 2020). This information is critical for determining time-sensitive health advisories for drinking water and recreation in water bodies impacted by HABs (US EPA, 2016; Oregon Health Authority, 2019).
The first known report of cyanotoxins was documented in Australia in 1878. In the United States, from 1882 to 1946, five states reported an occurrence of cyanotoxins [MN, CO, MT, IA, and ND (Yoo, 1995)]. These numbers have increased by orders of magnitude in recent years, leading to HABs being increasingly characterized as one of the largest threats to food and water resources in the future (Anderson, 2012; Graham, 2016). In 2014, the municipal water supply in Toledo, Ohio was contaminated with MC levels above the US EPA adult health advisory limit for drinking and resulted in non-potable water for 400,000 people (Jetoo et al., 2015; Qian et al., 2015). The maximum recommended recreational use value (RUV) for canine exposure is 0.2 ppb MC (CFR, 2022) (Table 1). The United States Environmental Protection Agency (US EPA) 10-day health advisory limit for infants is 0.3 ppb MC, and for 6 years old to adult is 1.6 ppb (MC) for drinking water (US EPA, 2019) (Table 1). The US EPA recommended RUV limits for MC and CYN toxin in recreational waters is 8 and 15 ppb, respectively (US EPA, 2016; US EPA, 2019).
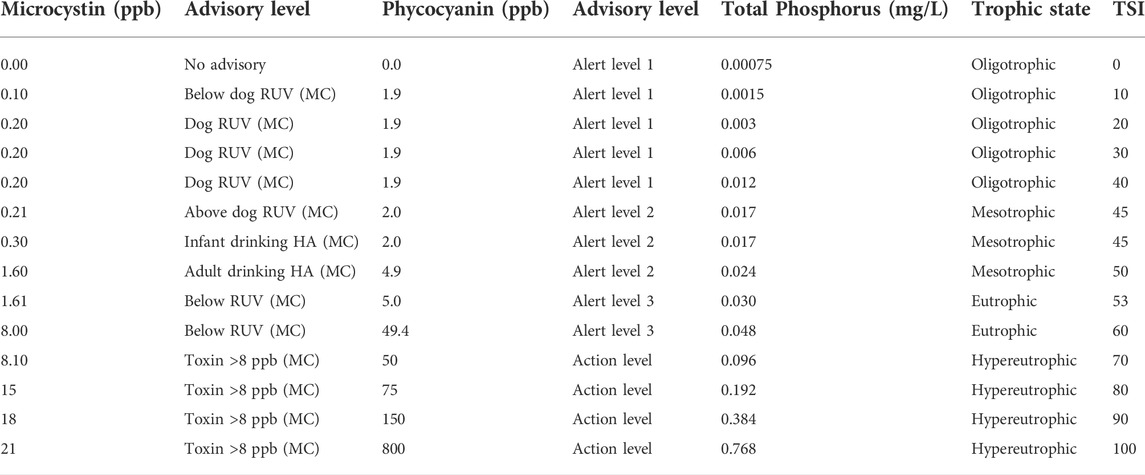
TABLE 1. Water quality index table with nomenclature to denote water quality based on concentration metrics for microcystin (MC), phycocyanin (PC), and phosphorus. This classification table is an expansion of the Trophic State Index (TSI) table in Carlson (Carlson 1977) that defined a range of total phosphorus concentration in freshwater lakes as oligotrophic, mesotrophic, eutrophic, and hypereutrophic (healthy to unhealthy). MC and PC concentration ranges have been defined here to create a more inclusive water quality index. The color bands denote water quality conditions relative to toxin load. Microcystin (MC) toxin concentration value ranges from 0.0–0.2 ppb are classified as Dog recreational use value (Dog RUV) (blue), 0.21–1.60 ppb are classified as Adult Drinking health advisory (HA) (green), 1.61–8 ppb are classified as below toxin RUV (yellow), and >8ppb is Toxin >8 ppb (orange) for MC. (EPA 820-R-15-100 (2015), EPA 822-R-10-001 (2019), Oregon Health Authority (2019). PC concentration ranges of 0–1.9 ppb (blue), 2.0–4.9 ppb (green), 5.0–49.4 ppb (yellow), and 49.41–800 ppb (orange) are denoted as Alert level 1, Alert level 2, Alert level 3, and Action level, respectively (Izydorczyk et al., 2009; Cotterill et al., 2019).
Two of the lakes in our study, GLSM and Lake Erie in Ohio, have a long history of HABs. One of the lakes, Lake Anna in Virginia, has only recently experienced a HAB, offering a unique look at a freshwater lake near a tipping point. GLSM experiences a HAB for most of the year and is nature’s example of an extreme HAB environment. GLSM is classified as a hypereutrophic system and has been designated as a distressed watershed since 2011 (Jacquemin et al., 2018). The West section of Lake Erie (including the southern basin) has been classified as Eutrophic on the trophic state index (TSI) scale since 1999 (Lake Erie Forage Task Group, 2020). Lake Anna is a recent location of concern with the potential to experience a seasonal HAB. Forty-eight water samples were collected in Lake Anna in 2018 by the Virginia Department of Environmental Quality (DEQ) and potentially toxigenic cyanobacterial cell counts were recorded by the Virginia Department of Health (VDH). Twenty-seven percent (13/48) of these samples had potentially toxigenic cyanobacteria counts above 100,000 (personal communication with VDH, 2021). All three of these lakes serve as unique locations that vary in their temporal and spatial distribution of HABs.
Nutrient runoff from agricultural and industrial sites that has been linked to the overall health of aquatic environments (Fraterrigo and Downing, 2008; Anderson, 2012). An increase in phosphorus content could push a population of cyanobacteria to be nitrogen-limited and shift toxin production from one congener of microcystin to another (MC-RR to MC-LR) (Maliaka et al., 2021). MC-LR is ten-fold more toxic than MC-RR (Zurawell et al., 2005). The TSI for lakes was developed to categorize lakes on a scale of 0–100 with each multiple of 10 representing a doubling of biomass (Carlson, 1977). TSI can be used to categorize lakes into oligotrophic (TSI 0–40), mesotrophic (TSI 41–50) eutrophic (TSI 51–60), and hypereutrophic (TSI 61–100) (Carlson, 1977) (Table 1). Oligotrophic lakes have a low level of nutrients and high level of water clarity, while eutrophic lakes have high nutrient levels, and a low level of water clarity. Hypereutrophic lakes have an extreme overload of nutrients, usually greater than 0.1 mg/L of phosphorus and 40 μg/L of chlorophyll. Lakes can transition between trophic states (Scheffer et al., 1993).
Collection guidelines for freshwater lakes and reservoirs differ based on the research objective. Reconnaissance studies usually address the presence of cyanobacteria, toxins, and compounds associated with taste and smell (Graham et al., 2008). Interpretive studies are generally long-term studies that assess environmental factors that affect the occurrence of cyanotoxins. Depth-integrated studies are continuous or discontinuous with equal intervals of collections. The potential location and vertical distribution of cyanobacteria in the water column has been described as having six general configurations in lakes and reservoirs (Graham et al., 2008). Open water accumulation, surface scum, and photic zone distributions were shown to have cyanobacteria present at the surface and evenly distributed below the surface at least halfway to the lake bottom (Graham et al., 2008). Discoloration is usually obvious in such locations (blue-green, or brown, or red), and filaments or large colonies may be visible at or near the surface. Cyanobacteria sample collections for recreational areas are typically collected as surface samples or integrated photic zone samples. Our study was a reconnaissance type study carried out in three recreational freshwater lakes that had a history of HABs, visible discoloration at the time of sampling, with occasional scum or large clumps of cells near the shoreline.
Within the last decade, a variety of remote sensing tools have been used to study freshwater HABs. Stumpf et al. (2016) used satellite images to map distributions of cyanobacteria and predict MCs. The relationship between MC and cyanobacterial pigments was analyzed using data from three different lake studies. Derivative algorithms were determined to be the most robust predictors of cyanotoxins. Mishra et al. (2021) took satellite-based measurements one step further and compared detection of cyanobacteria to MC data. Data were collected from 30 different lakes in 11 states, and the authors showed that their algorithm could be used as a pre-screening tool to identify areas most likely to experience a HAB. A variety of measurements used in multiple linear regression models were accurate above 80% of the time when site-specific locations were tested in Ohio (Francy et al., 2020). Accuracy above 90% was achieved when continuous monitoring data was used in the models to forecast toxin levels over the action threshold. Correlations between pigment measurements (e.g., phycocyanin, PC and Chl-a) and cyanotoxins are difficult to predict, and studies thus far have focused on specific locations with historic water quality data that extends over several seasons (or years). Recently, drone imagery was used to detect and characterize rhodamine dye (a surrogate HAB) in the ocean (Filippi et al., 2021). This method could find use in freshwater lakes to pinpoint areas of sample collection that would be most useful in determining water quality metrics in lakes with a history of HABs.
Traditional water sampling methods collected by hand are labor intensive, arduous, and require the use of various pump technologies in conjunction with water sampling devices (e.g., Wilde et al., 1998). For example, inertial, peristaltic, pneumatic, and bladder pumps have been used and some of these require compressors on site to run these pumps. The United States Geological Survey (USGS) has used devices such as the Kemmerer sampler, the Van Dorn, and a double check-valve bailer for water sampling (Wilde et al., 1998). Primary disadvantages of these samplers are the care needed to prevent cross-contamination between samples, time needed to implement these monitoring protocols, often narrow spatial coverage of possible sampling, and requisite personnel expertise to maintain sampling consistency. Thus, new tools and accessible technologies with quick turn-around times are needed to understand the fate and transport of HABs and their associated toxins. Recent advances in uncrewed robotic systems offer one solution to many of these problems and have allowed researchers to conduct environmental research in aquatic systems at an unprecedented level of detail (Powers et al., 2018a; Powers et al. 2018b; Powers et al., 2018c; Ribas-Ribas et al., 2019). Aerial and aquatic robots have been used to collect and characterize microorganisms (Powers et al., 2018b) and detect and track fluorescent dyes (surrogates for hazardous agents) in lakes (Powers et al., 2018a) and the ocean (Filippi et al., 2021). Ore et al. (2015) developed a pump-driven drone water sampling platform for water quality measurements in a variety of aquatic environments. Benson et al. (Benson et al., 2019) used the DrOne Water Sampling SystEm (DOWSE) to collect water and study microorganisms from eight remote Alpine lakes in Austria. Drones have also been used to collect samples from hazardous pit lake environments (Castendyk et al., 2020). Koparan et al. (2020) developed adaptive water sampling approaches for bathymetry and turbidity maps at Lake Issaquena, SC. In recent years, water quality sampling equipment has become easier to manage with faster sampling times and autonomous systems have enabled the collection of environmental samples in remote or dangerous locations. The ability of the DOWSE to collect numerous samples at different distances from shore or boat and the quick turnaround time for preliminary water quality data highlight the potential for predicting and tracking HABs to inform citizens and establish possible mitigation protocols.
The overall goal of this work was to use drone-based water sampling methods to characterize cyanotoxins, phycocyanin, and nutrients in three freshwater lakes in the United States that had active HABs. We chose water quality metrics with specific measurements to provide indicators for human and animal health (cyanotoxins), the presence of cyanobacteria (phycocyanin), and the extent of anthropogenic influence (nutrients). This study was specifically designed to quickly gather small-volume samples and produce a rapid turnaround of measurable water quality using a small set of metrics. The specific objectives of our work were to 1) collect surface water samples using a drone-based water collection system (DOWSE) at different distances (10–100 m) from the shore and from an anchored boat in GLSM, Lake Erie, and Lake Anna and 2) characterize cyanotoxins, phycocyanin, and nutrients in drone water samples from each of the lakes while establishing improved understanding of the relationships among these parameters. Our work demonstrates the potential for drone-based water sampling technologies to be used by public health and water quality experts to provide critical and timely information for regulatory decisions and health advisories.
Materials and methods
Lake collections using the DrOne water sampling SystEm
The DOWSE (Benson et al., 2019) was used to collect water samples from three freshwater lakes with active HABs. Briefly, a Phantom 4 quadcopter (DJI, Shenzhen, China) outfitted with a carbon fiber mount on the landing gear was used to gather water samples by attaching the 3D printed water sampler apparatus to the quadcopter with a 4.6 m tether line (Figure 1). The water sampler was lowered to the surface until the sample tube filled with water. Once the water sample was at the surface, a picture was taken from the drone showing the sampler in the water. Each drone image contains metadata that ultimately allows the precise location of the sampler in the lake to be determined (Filippi et al., 2021). This method was repeated for each sampling point along a 100-m transect (10–100 m) [e.g., transects as highlighted in (Benson et al., 2019)] from land or from an anchored boat until 10 samples were collected for each flight. The average time span between the first (10 m) and last (100 m) collection along the transect was 12 min. Ten water samples spaced 10 m apart from each other, and collected in a short time frame, allowed for variability of water quality metrics to be compared across a 100 m transect. A freshly opened sterile tube was inserted into the water sampling device immediately before each collection. As each sample was returned via the drone tether (to shore or boat), the filled sample tube was replaced with a freshly opened sterile collection tube while the drone hovered in place to allow for sample tubes to be switched quickly. Following the ten sample collections for each flight, a 50 ml control tube was filled with sterile water and flown out to the furthest collection point (100 m from the shore or boat), held at an altitude greater than 4.6 m above the lake surface, and then returned via the tether to be capped and stored with each flight sample set of ten tubes. To avoid potential cross contamination among lakes, a new tether was used for each of the lakes and the sampling devices were soaked in a dilute solution of sodium hypochlorite. Water samples were held on ice in a cooler in the dark until all samples were collected for each sampling day.
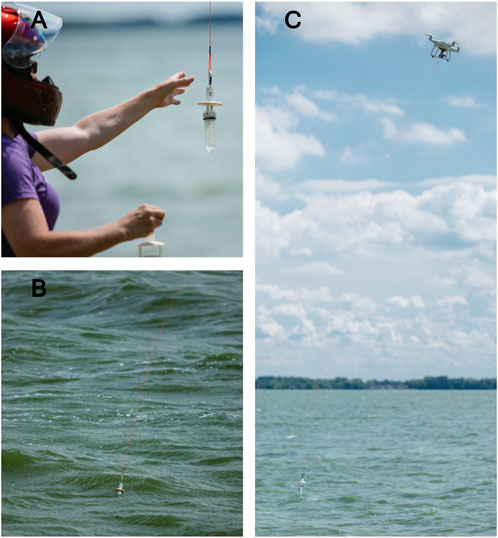
FIGURE 1. The DrOne Water Sampling SystEm (DOWSE) returning a water sample collected in 2019 at GLSM in Celina, OH (A). The DOWSE collects water samples at the surface (B), and a drone returns the filled sample tube in the sampler on a 4.6 m nylon tether (C).
Lake study sites
Field experiments were conducted at GLSM, Celina, OH, Lake Erie at Maumee Bay OH, and Lake Anna, Mineral, VA (Figure 2). Seasonal HAB conditions persist at both GLSM and Lake Erie during August. Lake Anna is a recent concern for HABs so August and September provided two temporal measurements when potential toxins could be measured toward the end of the season when cyanobacterial accumulation and or cell death could provide a scenario of increased toxin production at levels that could be detected, especially in a lake that has recently been identified as a potential HAB concern. Samples were collected from GLSM (August 5–6), Lake Erie (August 8), and Lake Anna (August 23, and September 10) during the 2019 HAB season. GLSM covers 13,500 acres and is a shallow (5–7 feet in depth) man-made reservoir lake constructed from 1837 to 1845. The Celina Water Plant began testing intake water from GLSM for MC in 2009 and continues to test weekly for the presence of toxins as part of the water purification process. Lake Erie is the 11th largest lake globally and covers over six million acres. For over 20 years, Lake Erie has been plagued with HABs that produce MC and in 2014 the Toledo water crisis left half a million people without safe water. Lake Anna is another inland reservoir lake that covers 13,000 acres. The lake bottom was cleared, and the North Anna River dam was completed in 1972. Cyanobacterial cell counts of potentially toxigenic taxa have been reported as above recreational advisory thresholds at Lake Anna since 2018 (>100,000 cells/ml). These freshwater lakes were sampled in field year 2019 and are shown in Figure 2. Freshwater samples were collected from a single location at GLSM and Lake Erie. The GPS location in decimal degrees (DD) for GLSM (40.544873, −84.510843) is shown with a green map marker and for Lake Erie (41.702472, −83.463598) with a red marker. Collections at Lake Anna (Lake Anna) were carried out at 12 unique locations (Figure 2). GPS locations for Lake Anna are listed in Table 2. These locations were selected based on the predictable incidence of annually occurring HABs (GLSM, Lake Erie) and/or high cyanobacteria cell counts, >100,000 cells/ml of potentially toxigenic species, or >40,000 cells/ml of Microcystis species (Lake Anna).
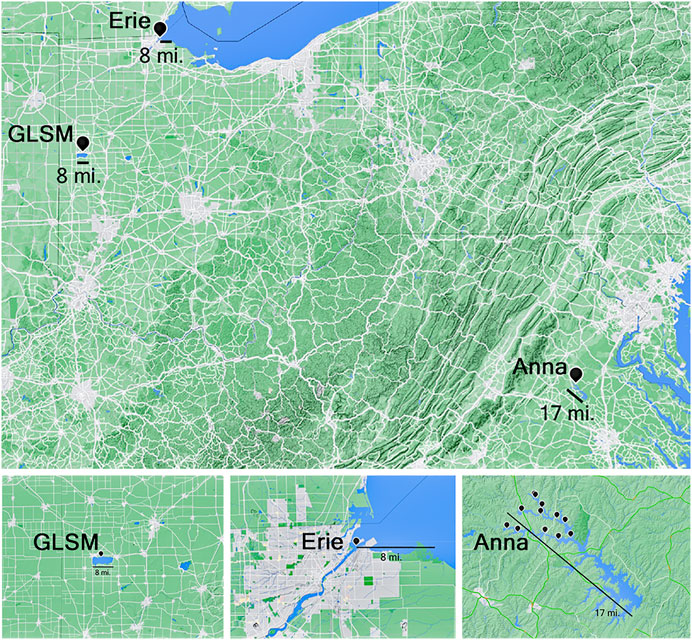
FIGURE 2. Three freshwater lakes with known HABs were sampled in the US in 2019. Locations are marked as follows: Grand Lake Saint Mary’s (GLSM), Celina, OH (40.544873, −84.510843), Lake Erie at Maumee Bay, OH (41.702472, −83.463598), and Lake Anna, Mineral, VA (multiple sampling locations, with 38.10642, −77.84076 designating the location near the “splits” at the State Park). GLSM, was sampled on August 5–6, Lake Erie was sampled on August 8, and Lake Anna was sampled on August 23 and September 10.
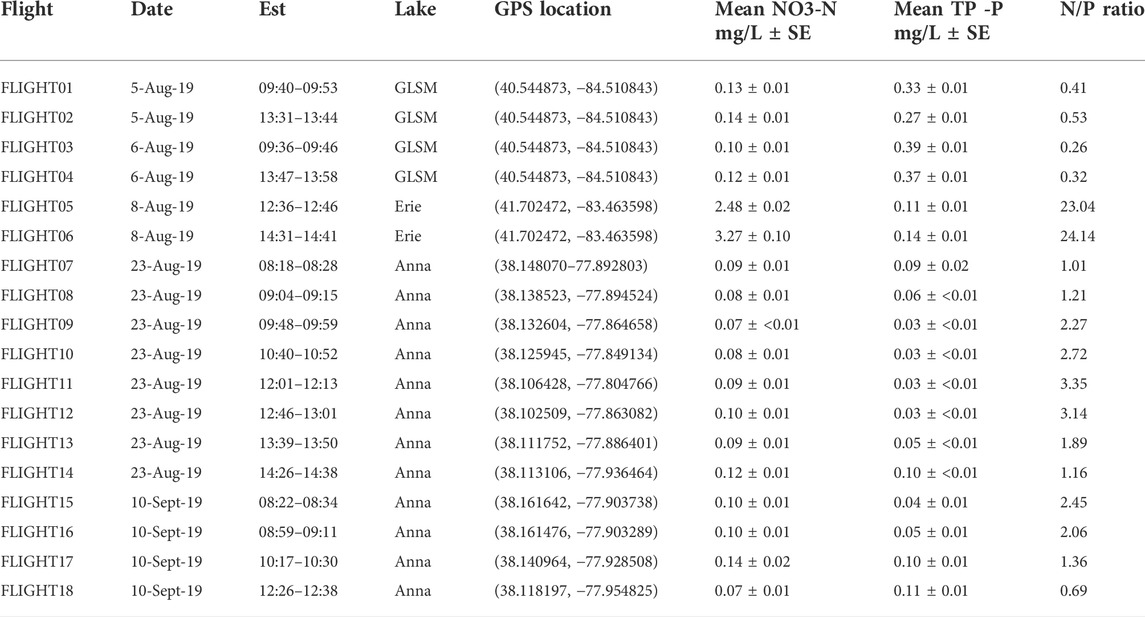
TABLE 2. Details for each of the drone flights including date of collection, lake (Grand Lake St Mary’s, Erie, or Anna), time (24-h), GPS location of launch site on ground or from boat, Nitrate-N (mg/L), total phosphorus (mg/L), and N/P ratio.
Handling of water samples
Water samples were aliquoted on the day of collection. Tubes were labeled for toxin analysis and nutrient determination for all flight samples (Figure 3). Tubes for downstream toxin analysis were frozen at −20°C. The remaining sample tubes were held at 4°C prior to processing.

FIGURE 3. Schematic illustrating how samples were processed for each 50 ml drone water sample. Aliquots were made for toxin analysis (5 ml), nutrient analysis (10 ml), and filtrate nutrient analysis (</ = 0.45 µm) (10 ml), for all flights. One milliliter was aliquoted for flow cytometry (1 ml) from Lake Anna collections (Flight 07–Flight 18). The remaining volume in the 50 ml collection tube was adjusted to 12 ml and used for phycocyanin (PC) readings with the Cyclops-7 sensor from Turner Designs, Inc. (Sunnyvale, CA) on the day of collection. PC data was recorded with the Precision Measurement Engineering data logger (Vista, CA).
Cyanotoxin analysis with LC‐MS/MS
Water samples from the three lakes were analyzed for the presence of putative cyanotoxins (Table 3) with the most abundant toxins in each lake shown in Figure 4. Toxin analysis was performed at the Lumigen Instrument Center, Wayne State University, Detroit, MI. The 15 cyanotoxins analyzed include 12 microcystins (MCs), nodularin, anatoxin-a, and cylindrospermopsin. The internal standard C2D5 MC-LR* was run with the suite of MC toxins and nodularin, whereas, two internal standards, L-Phenylalanine-D5** and Uracil-D4** were analyzed in the anatoxin-a and cylindrospermopsin suite. Sample aliquots of 5 ml were subjected to three freeze-thaw cycles and analyzed by LC-MS/MS with controls to determine toxin concentrations. The Lumigen Instrument Center tested for cyanotoxins using two methods. One method included 12 MC congeners and nodularin (NOD), and the second method cylindrospermopsin and anatoxin-A.
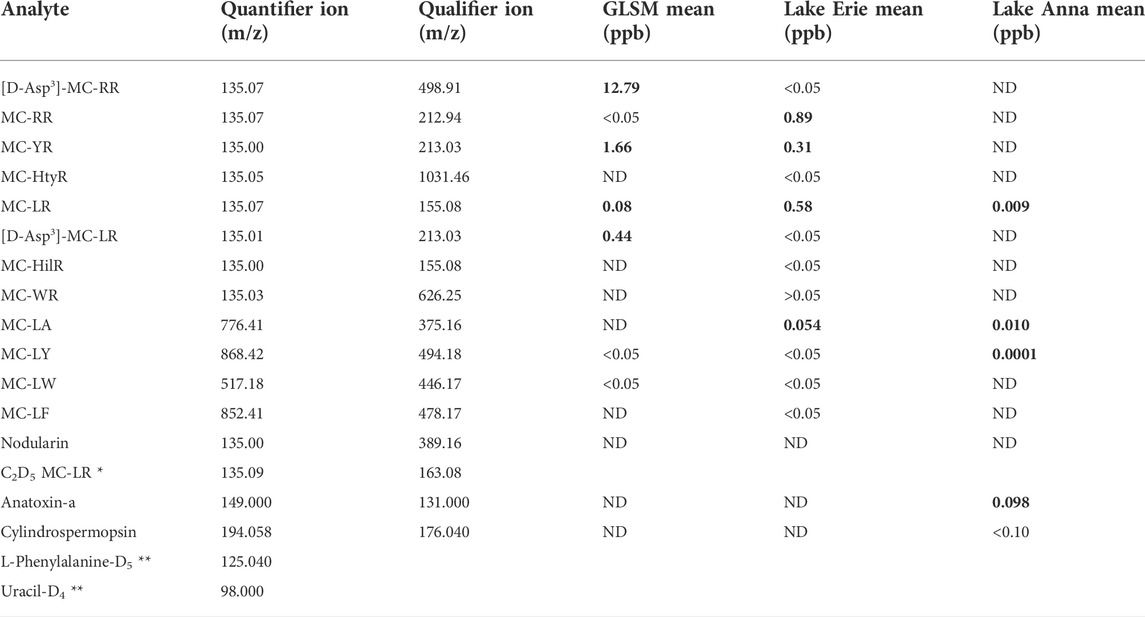
TABLE 3. List of 15 cyanotoxins analyzed in drone water samples. Toxins not detected are noted as ND. The MCs present at a mean above 0.05 ppb at GLSM and Lake Erie are noted in bold and shown in Figure 4 for two flights from each lake. At Lake Anna three MC were detected in addition to Anatoxin-a. These toxins are noted in bold and shown for two flights from Lake Anna (Figure 4).
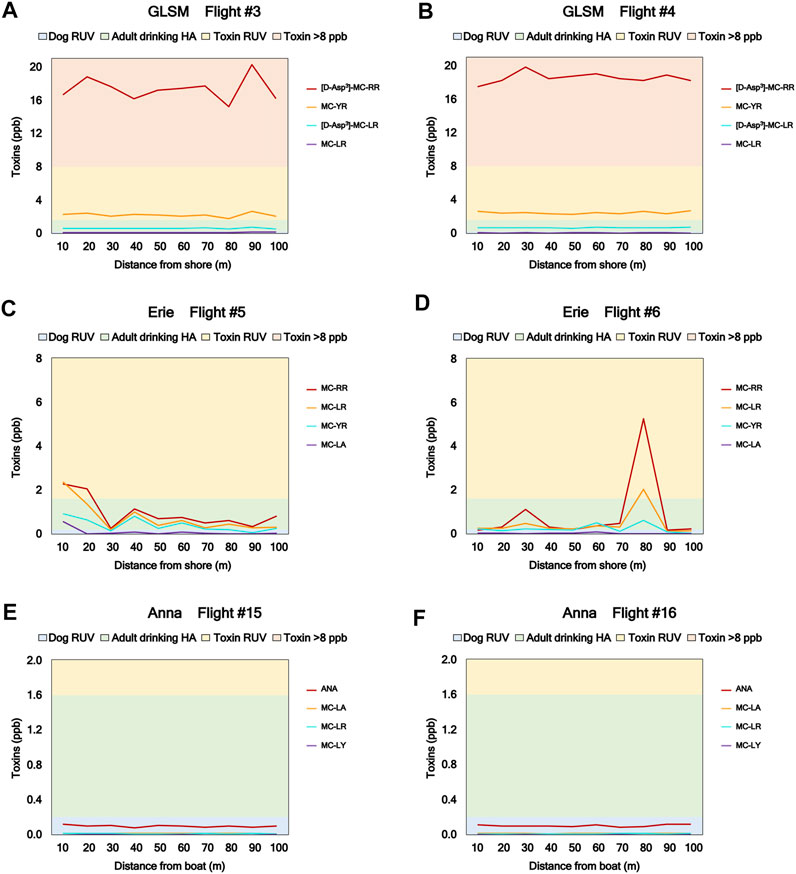
FIGURE 4. Graphical summary of toxins from two flights collected from each lake. The data shown for GLSM (A,B), Lake Erie (C,D), and Lake Anna (E,F) were collected in consecutive flights. Distance across the 100 m transect is shown on the x-axis. Toxin concentration in ppb is shown on the y-axis. The color bands denote water quality conditions relative to toxin load. Water quality metrics for MC toxin concentrations are shown in Table 1 and correspond to the trophic state lake classifications of oligotrophic (blue), mesotrophic (green), eutrophic (yellow), and hypereutrophic (orange).
The detection of MCs and nodularin using LC-MS/MS was completed using the method described in Birbeck et al. (2019). Briefly, samples were analyzed by an online concentration method using a Thermo Scientific TSQ Altis™ triple quadrupole mass spectrometer (Thermo Scientific, Waltham, MA, United States) with an EQuan MAX Plus™ system. An injection volume of 1 ml of sample was injected onto the loading column (Thermo Scientific Hypersil GOLD aQ 2.1 × 20 mm, 12 µm particle size) using an HTC PAL autosampler (CTC Analytics, Zwingen, Switzerland). Analytes were then separated on a Thermo Accucore aQ, 50 × 2.1 mm, 2.6 µm particle size column. Mass spectrometry analysis was performed using an electrospray ionization source in positive ion mode.
The detection of anatoxin-a and cylindrospermopsin were analyzed using a Thermo Scientific TSQ Altis™ triple quadrupole mass spectrometer (Thermo Scientific, Waltham, MA, United States) with an EQuan MAX Plus™ system. Samples were separated on a Hypersil GOLD™ aQ C18 columns, 2.1 × 100 mm, 1.9 µm. Mobile phases for the step gradient were (A) 100 mM acetic acid in LC-MS grade water and (B) 100 mM acetic acid in LC-MS grade methanol. The flow rate was set at 0.4 ml/min and gradient started at 0% B from 0 to 0.1 min, stepped to 10% B from 0.1 to 2.7 min, then stepped to 95% B from 2.7 to 4.7 min. At 4.71 min the gradient was stepped back down to 0% B until 7.5 min for re-equilibration. Sample injection volume was 10 μl, and the column temperature was held constant at 30°C. All analysis was in positive ion mode, and the mass spectrometer settings were as follows: positive ion voltage at 3500 V, sheath gas (arb units) at 45, aux gas (arb units) at 13, sweep gas (arb units) at 1, ion transfer tube temperature (°C) at 342, and vaporizer temperature (°C) at 358. Transitions that were used for the cyanotoxins are listed in Table 3. Data were analyzed using TraceFinder™ EFS 4.1 where retention time, and quantitative and qualitative ion qualifications were set and monitored to ensure proper cyanotoxin identification.
Phycocyanin concentration using the Cyclops-7 sensor
Freshwater cyanobacteria produce phycocyanin, and the presence of this pigmented protein can be measured to give an indication of the concentration (i.e., estimate of biomass) of cyanobacteria in a collected water sample. The biomass of cyanobacteria does not have a direct correlation to cyanotoxin production or toxin concentration (Christensen et al., 2019; Christensen et al., 2022). The use of the word biomass in this manuscript is not critically defined but used as a common language word in reference to its relationship with nutrient levels, its use in the description of trophic lake state values, and its use as a possible indicator of elevated PC pigments. This objective measure of PC can be recorded as parts per billion (ppb) or micrograms per liter (µg/L) in a water sample and these values can be used to assign risk levels to areas of HAB concern (Cotterill et al., 2019; Thomson-Laing et al., 2020). Alert level 1 and 2 indicates a state of surveillance while alert level 3 indicates the need for repeat testing. Action level indicates that advisories should be posted by authorities to inform citizens that a specific aquatic environment is a potential human health hazard. Last year in Virginia total potentially toxigenic cyanobacterial counts at or above 100,000 cells/ml or total MC species counts at or above 40,000 cells/ml were used as the action level advisory limit for posting HAB warning signs (US EPA, 2019). A Precision Measurement Engineering data logger outfitted with a Turner Instruments Cyclops-7 PC sensor (Model No: 2110-000) was used to collect PC measurements (Figure 5). Water samples were moved to room temperature 20 min prior to PC measurements. For all collections, the sensor was submerged into approximately 12 ml of lake water and held in place 2.4 cm from the bottom of a 50 ml conical tube. The sensor collected PC concentration in ppb at 5-s intervals in the dark for a minimum of 30 s. The PC sensor was rinsed with distilled water and wiped with a Kimwipe between each sample. Distilled water blanks were measured prior to, and after completion of, sample readings.
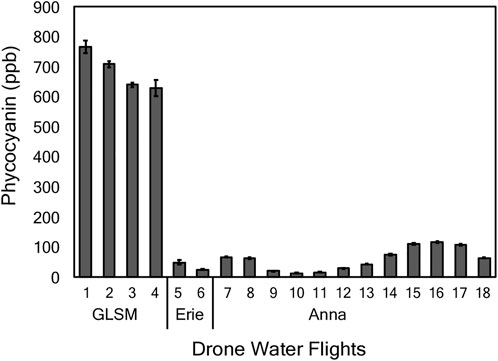
FIGURE 5. Phycocyanin (PC) values shown in parts per billion (ppb) for the 18 flights collected at the three lakes in field year 2019. Four flights were collected from GLSM, two from Lake Erie, and 12 from Lake Anna. The mean PC concentration at GLSM, Erie, and Anna was 687, 38, and 62 ppb, respectively. The error bars represent standard error of the mean (n = 10) for the ten transect tubes collected for each flight.
Phycocyanin sensor calibration
The Cyclops-7 PC sensor (Model No: 2110-000) was calibrated with the Cyclops Solid Standard (Turner, cat # 2100-900, rev. J). The rhodamine WT (water tracing), 400 ppb (cat # 6500-120) liquid calibration standard was diluted to 200 ppb and the sensor calibration set point was equilibrated to 260 ppb PC as per manufacturers specifications.
Nutrient analyses for phosphorus and nitrogen
Phosphorus and nitrate concentrations (mg/L) were determined for all lake collections. These small volume samples were designed to provide a rapid turnaround of measurable nutrients. To this end, we analyzed samples for nitrate-N and not for total Kjeldahl nitrogen. Analyses were performed at the Wright State University Lake Campus, Celina, OH. Upon collection, a portion of the water was immediately filtered (</ = 0.45 µm), at which point both samples were kept in the dark at 4°C prior to nutrient analyses. All samples were analyzed within 24 h to 2 weeks of collection. The raw (unfiltered) sample was used to determine total phosphorus (0.025 mg/L MDL) following acid-persulfate sample digestion while the filtered portion of the samples was used to determine dissolved reactive phosphorus (Ortho-P 0.025 mg/L LOD) and nitrate-N (NO3-N 0.15 mg/L MDL) concentrations. Due to sample volume limitations, it was not possible to analyze samples for total Kjeldahl nitrogen (and thus total nitrogen as a function of TKN + NOx). Phosphorus concentrations were assessed using ascorbic acid methods (EPA 365.1; www.ecfr.gov/) while nitrate was measured using the dimethylphenol method (EPA 40 CFR 136; www.ecfr.gov/) using a benchtop visible spectrum spectrophotometer (HACH DR 3900). A series of blanks, analytical duplicates, field duplicates, premixed standards, and spikes were run concurrent with every 20-sample batch. Specific to these QA/QC checks for this study, no instances of any appreciable variations greater than 10% from “expected” values were detected.
Results
Lake collections using the DrOne water sampling SystEm
A total of 180 water samples was collected across 18 flights at three freshwater lakes in 2019. Forty samples were collected from GLSM, 20 samples from Lake Erie, and 120 from Lake Anna. Each drone-based water sampling mission was comprised of a 10-tube transect over distances of 10–100 m. Temporal differences between sample sites ranged from 2 h to 18 days. Drone-sampling missions at GLSM and Lake Erie were performed from the shore at a single GPS location. Drone-sampling missions at Lake Anna were performed from an anchored boat at 12 different locations at 11 unique sites on the lake. Two drone samples at Lake Anna were collected within close spatiotemporal parameters; both transects were collected inside a 49-min time span, and within a lake surface area of 200 m2. Each sample site location was given a unique flight number, Flight 01–Flight 18 (Table 2). Flight 16, collected at Lake Anna on 10 September 2019 departed from a traditional line transect to target a visual pattern of floating expected on the surface of the lake.
Our collections incorporated ten measurements along a distance of 100 m in an effort to examine the potential variability of water quality metrics in a spatially repeatable sampling regime. Each flight was able to collect ten samples in a short time frame (12 min). Water quality metrics at GLSM and Lake Erie were repeated at the same location with various increments of time among collections. Since these lakes were experiencing late summer HAB conditions (i.e., August), the flights were able to explore high resolution temporal variation with repeated sample collections at the same site. The second sampling date at Lake Anna allowed for a spatial extension of water quality metrics in the three northern branches of the lake: Terry’s Run, Upper Pamunkey, and North Anna. The back-to-back sampling flights shown in Figures 4, 6, 7 were an example of the difference between morning and afternoon sampling times (when were able to conduct flights safely around inclement weather) for GLSM and Lake Erie. Lake Anna Flights 15 and 16 were collected in close spatial proximity since we were following visual scum on the lake surface. Consequently, the Lake Anna flights were both collected in the morning.
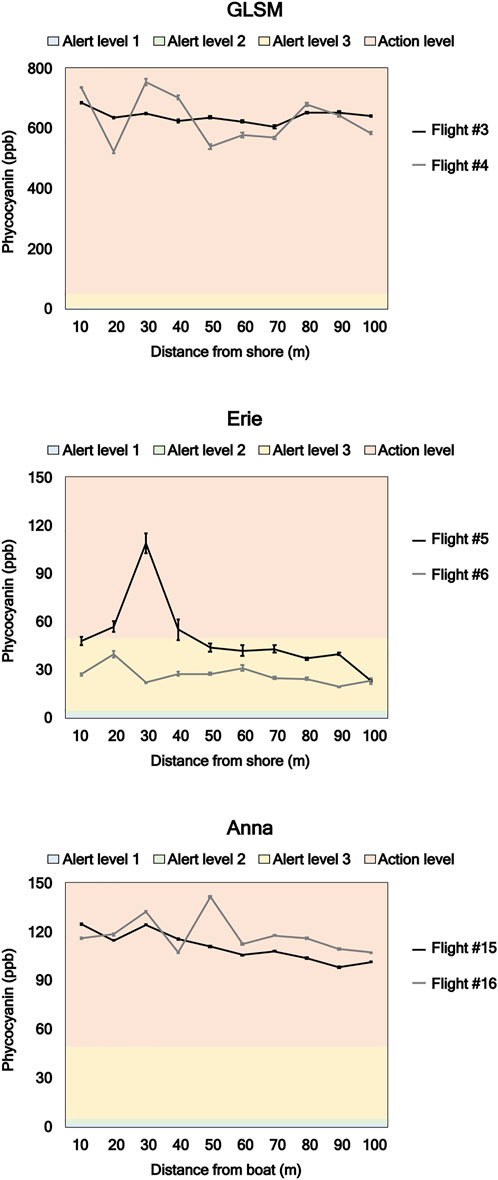
FIGURE 6. The concentration of PC from each transect location is shown for two consecutive flights from each lake. Distance across the 100 m transect is shown on the x-axis. PC concentration in ppb is shown on the y-axis with a scale of 0–800 ppb (GLSM), or a scale of 0–140 ppb (Lake Erie and Lake Anna). The color bands represent Alert level 1 (blue), Alert level 2 (green), Alert level 3 (yellow), and Action level (orange). The water quality metrics are shown in Table 1 and correspond to the trophic state lake classifications of oligotrophic, mesotrophic, eutrophic, and hypereutrophic.
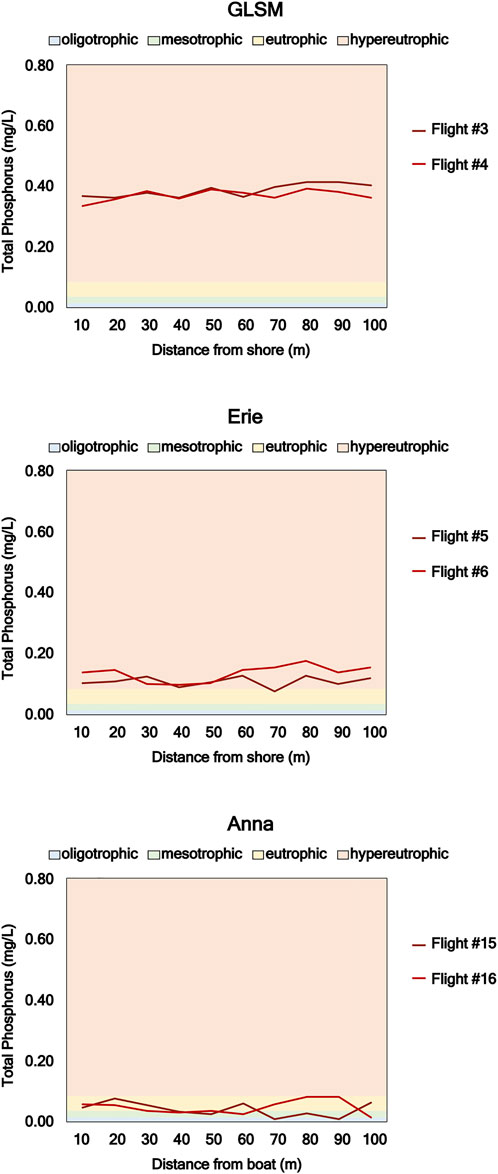
FIGURE 7. Graphical representation of total phosphorus from two consecutive flights collected on the same day, for each freshwater lake. The color bands denote lake water quality as oligotrophic (blue), mesotrophic (green), eutrophic (yellow), and hypereutrophic (orange) (Table 1). Trophic State Index (TSI) values for oligotrophic (TSI 0–40), mesotrophic (TSI 41–50), eutrophic (TSI 51–60), and hypereutrophic (TSI 70–100) follow the TSI table published by (Carlson, 1977). Collection points in 10-m increments are shown on the x-axis. Total phosphorus mg/L for both flights from each lake is shown on the y-axis. A total phosphorus concentration is 0–0.80 mg/L.
Cyanotoxin analysis with LC-MS/MS
Cyanotoxins were present in all three of the freshwater lakes. Graphical summaries of the four most abundant cyanotoxins in each lake are represented by two flights from each lake and are shown in Figure 4. The two flights from each lake represent measured variation across a 100 m transect with the same spatial location taken on the same day with little temporal variation. Three MC congeners were present in Lake Anna, seven in GLSM, and 12 in Lake Erie. Anatoxin-a (ANA) was only detected at Lake Anna, and was present in 93% (111/120) of the samples. Cylindrospermopsin was detected in a single collection at Lake Anna. Nodularin was not detected in any of the lake samples. The highest individual MC congener toxin level was found at GLSM (D-Asp3-Dhb7-RR) and was present at a mean value of 17.97 ppb. This concentration is well above the RUV advisory level of eight total ppb for MC as a result of the D-Asp3-Dhb7-RR congener values alone. Cyanotoxins with the highest mean concentrations from Flight 03 and Flight 04 at GLSM were D-Asp3-Dhb7-RR (17.97 ppb), MC-YR (2.32 ppb), D-Asp3-LR (0.619 ppb), and MC-LR (0.0719 ppb). All 12 congeners of MC were detected in the western basin of Lake Erie in a total of two collections, Flight 05 and Flight 06. Ten MC congeners were detected in at least 65% (13/20) of the samples. MC-HtyR was detected in 30% of the samples (6/20) and MC-LF was detected in 10% (2/20) of the Lake Erie collections. The four toxins with the highest mean toxin concentration in Lake Erie were MC-RR (0.893 ppb), MC-LR (0.579 ppb), MC-YR (0.310 ppb), and MC-LA (0.0544 ppb). Several samples from Lake Erie had MC concentrations above the adult drinking health advisory limit of 1.6 ppb (Table 1). Three of the 12 MC congeners were present in Lake Anna. MC-LA and MC-LR were identified in 77% (92/120) and 85% (102/120) of flight collections, respectively, while MC-LY was exclusively detected in Flights 15–16. The most abundant cyanotoxins identified in Lake Anna from Flight 15 and Flight 16 were ANA (0.0984 ppb), MC-LA (0.0124), MC-LR (0.00959), and MC-LY (0.00130). The US EPA RUV limit for MC and ANA is 8 ppb.
Phycocyanin
PC concentrations from the three lakes was measured for each of the 18 flights (Figure 5). GLSM had the highest PC values with a mean of 687 ppb for Flight 01–Flight 04. The mean PC from Lake Erie (Flight 05 and Flight 06) was 38 ppb. Lake Anna had a mean of 62 ppb for the 12 flights (Flight 07–Flight 18) collected on both sampling days, 23 August and 10 September 2019. A subset of six flights was chosen to analyze PC concentration at each 10 m interval (Figure 6) on a color band graph to show the alert level of PC as listed in Table 1 (Izydorczyk et al., 2009; Cotterill et al., 2019). The flights chosen for each lake were Flight 03–Flight 04 (GLSM), Flight 05–Flight 06 (Lake Erie), and Flight 15–Flight 16 (Lake Anna). The high PC concentrations in GLSM and Lake Anna place these lakes in the Action level. PC concentrations in Lake Erie declined between the morning Flight 5 (action level) to the afternoon Flight 6 (Alert level 3) in a time span less than 2 h.
Nutrient analyses for phosphorus and nitrogen
A graphical summary of total phosphorus mg/L concentration is shown for two drone-sampling missions for each lake in Figure 7 (Lake Erie Forage Task Group, 2020). Total phosphorus was the highest at GLSM, with a mean TP-P concentration of 0.378 mg/L (Flight 03 and Flight 04), placing GLSM in a hypereutrophic state (0.0481–0.768 mg/L) for phosphorus content as denoted in Table 1 (Carlson, 1977). Lake Erie was just above eutrophic levels for phosphorus with a mean TP-P concentration of 0.122 mg/L for Flight 05 and Flight 06. Flight 15 and Flight 16 from Lake Anna had a mean concentration of 0.043 mg/L TP-P, placing this lake in a eutrophic state (0.0241–0.048 mg/L) for phosphorus. Individual water samples for phosphorus in Lake Anna spanned both mesotrophic (0.0121–0.024 mg/L) and eutrophic lake state values. Dissolved reactive phosphorus (Ortho-P) was highest in GLSM with a mean of 0.139 mg/L (0.127–0.153 mg/L) followed by Lake Erie with a mean of 0.022 mg/L (BDL-0.046 mg/L) and Lake Anna with a mean of 0.01 mg/L (range BDL-0.021) mg/L). Nitrogen content measured as nitrate (NO3-N) was the highest at Lake Erie with a mean of 2.875 mg/L (Flight 05 and Flight 06), placing Lake Erie in a hypereutrophic state (1.471–23.6 mg/L) for total nitrogen content even without total Kjeldahl nitrogen (TKN) measurements to add to these NOx values (Kratzer and Brezonik, 1981). GLSM (Flight 03 and Flight 04) and Lake Anna (Flight 15 and Flight 16) had mean nitrate concentrations of 0.111 and 0.097 mg/L NO3-N, respectively (Table 2). It is worth noting that grab samples from GLSM around this time indicated TKN values between 3 and 4 mg/L (unpublished data), unsurprisingly, likely putting GLSM above Lake Erie or Lake Anna.
Discussion
New remote sensing tools and technology are needed to detect and monitor freshwater HABs. The distribution of cyanobacteria in aquatic habitats is influenced by a variety of anthropogenic and environmental factors that are in constant flux (Anderson, 2012; Graham et al., 2016). Not all cyanobacteria produce cyanotoxins, and limitations in testing capabilities further limit water quality assessments. We used a unique DrOne Water Sampling SystEm (DOWSE) to collect water samples from three HABs in three freshwater lakes in the United States. Drone water sampling technologies can be deployed quickly and can provide access to remote areas that are not easily accessible or typically monitored (Ore et al., 2015; Benson et al., 2019; Filippi et al., 2021). This study demonstrates the utility of a such a rapid water sampling system capable of obtaining water samples to assess the parameters one would require to better understand a HAB (e.g., concentrations of toxins, phycocyanin, and nutrients). In addition to quick sampling capabilities in remote aquatic locations, advantages of our drone-based water sampling approach include the ability to collect surface samples without disturbing the surrounding water and without entering a body of water on foot and wading out to grab a sample. Disadvantages include the need for drone equipment and a certified (and preferably skilled) drone pilot. Though GLSM and Lake Erie have a long history of HAB research, our work represents the first drone-based water sampling of these lakes. Moreover, our work is the first to report anatoxins in surface water samples of Lake Anna—a lake with a relatively new (young) HAB near its tipping point.
Cyanotoxins were measured from each of the samples because they provide an indication of a potential health hazard to humans and domestic animals. Representative congeners of the cyanotoxin MC were present in each of the lakes. GLSM was characterized by total MC levels that averaged 15 ppb, well above the RUV of 8 ppb (Figure 4). The total MC toxin levels at Lake Erie and Lake Anna were lower than GLSM, with mean values of 1.92 and <0.02 ppb, respectively. The MC concentrations at Lake Erie were highly variable with concentrations both above and below the adult drinking health advisory limit (1.6 ppb) in the same flight (Figure 4). This variability of MC concentration within a distance of only 100 m highlights the importance of testing multiple water samples across space and time. Another example of spatial variability of MC toxins was observed in the Prespa Lakes, Greece during 2012–2014 (Maliaka et al., 2021). Concentrations of MC in Lesser Prespa ranged from 25 to 861 ug/L (ppb) in 2014. In addition to the spatial heterogeneity observed in MC toxin concentrations in Lake Lesser Prespa, a high variability was observed in the surface accumulation of cyanobacteria in 2012 (Maliaka et al., 2021). The cyanotoxin levels found in Lake Anna were much lower than the other lakes and were below the dog RUV level (Figure 4). Interestingly, Lake Anna was the only lake that showed the presence of the anatoxin-A (ANA) (the US EPA RUV limit for ANA is the same as MC at >8 ppb). Several cyanobacteria can produce ANA, including Anabaena, Aphanizomenon, Cylindrospermum, Microcystis, Planktothirix, and Raphidiopsis (Varner, 2018). Though the genus or genera of cyanobacteria in Lake Anna that are responsible for ANA production are presently unknown, the potentially toxigenic cyanobacterial genera with counts above 100,000 cells/mL as reported by VDH for Lake Anna in 2018 were Microcystis, Cylindrospermopsis, Rahpidiospsis, Pseudoanabaena, and Planktolyngbya (personal communication with VDH, 2021). Anabaena, Aphanizomenon, and Planktothrix were among the potentially toxigenic taxa identified at Lake Anna in 2018 (personal communication with VDH, 2021) at counts lower than the 100,000 cells/mL threshold for concern. A recent algal bloom assessment in 2021 listed Pseudoanbaena, Raphidiopsis, and Planktolyngbya as dominant species in the North Anna branch (Solitude Lake Management, 2022). High-use recreational areas with HABs need timely information regarding the presence of cyanotoxins above RUVs. This information should be used to keep citizens informed about how safe it might be to have their dog at the lake or if toxin levels could cause skin irritation.
Phycocyanin was analyzed because this pigment is a signature of cyanobacteria, and different sensors are available to measure PC and other pigments found in water due to the presence of living organisms. Phycocyanin was present above action levels in GLSM and Lake Anna. Although Lake Erie had a lower average PC, samples along 100 m drone water sampling transects ranged from Alert level 3 to Action level within a 2-h time interval. This highlights the need for quick remote sampling capabilities that could be used to provide health advisory data on a body of water that provides drinking water to a population of over 400,000 residents.
Phosphorus and nitrogen content was measured because these components contribute to growth and accumulation of cyanobacteria in freshwater environments. Phosphorus levels varied from oligotrophic (Anna) to hypereutrophic (GLSM) (Figure 7). The total phosphorus load measured at GLSM was extremely high and stable in the hypereutrophic range. Although our measurements were taken in a single month, the mean value of total phosphorus measured bimonthly in 2019 at GLSM (samples were collected by hand) was 0.30 mg/L (S. Jacquemin, unpublished observations). This value is hypereutrophic and in line with our drone sampling of GLSM. Lake Erie had phosphorus levels that were just above eutrophic, and Lake Anna ranged from oligotrophic to eutrophic. It is important that future studies ensure multiple species of nitrogen are measured to be able to calculate total nitrogen as well as phosphorus. Such measurements are important in the context of environmental changes required to improve water quality; after 2011 Distressed Watershed legislation limited allowable nutrient loads in the agricultural watershed the water quality improved tremendously (Jacquemin et al., 2018). Specifically, reductions were more notable during winter months when a ban on manure was implemented, and all parameters were decreased by 20%–60%. However, analyzing multiple species of nitrogen in a water sample requires increased sample volumes, which depending on the analytical methods used could be up to 150 ml. Should larger volumes of water be necessary for future work, our water sampling device could be modified to sample larger volumes of water. Such a design modification would need to consider the payload limits of the platform (for the drone used in this work, the sampling payload when full of water should not exceed 500 g for safe operations) and reduced flight times due to additional battery consumption to power the drone with a heavier payload.
Our work to characterize HABs in different freshwater lake environments could be enhanced by additional information from other technology platforms. We were able to quickly sample and characterize HABs in three freshwater lakes using a unique drone-based water sampling approach. Though we focused our analyses on cyanotoxins, phycocyanin, and nutrients, future work could include additional analyses such as cyanobacterial concentrations or other water quality parameters. Such analyses would likely require larger collection volumes; our current sampling method is limited to sampling 50 ml of water. Future work could include additional remote sensing tools such as the Cyanobacteria Monitoring Collaborative website (Cyanobacteria.org, 2021) or the new US EPA CyAN web application released July 2021 (US EPA, 2019). The EPA CyAN platform is free and designed to support real-time decisions regarding HABs based on the Copernicus Sentinel-3 European satellite. The CyAN imagery interface is a new web-based tool that could be used in future research efforts to add another layer of information to current tools and technology. For example, the CyAN could be used with real-time water quality measurements to observe changes in a HAB that was characterized by high levels of MC-RR and could shift to the MC-LR congener due to a decrease in total available nitrogen. In August 2019, the higher level of nitrogen content relative to phosphorus at Lake Erie could favor the nitrogen rich congener, MC-RR over the more toxic congener, MC-LR (MC-RR was the most abundant congener with MC-LR the next abundant congener). A shift in nutrient content in the Western basin area of Lake Erie that would favor the MC-LR congener, could quickly pose a safety hazard to drinking water in the greater Toledo area. This is notable with regard to Lake Erie, because the MC congeners with the highest concentrations were MC-RR and MC-LR and several collections along the 100 m transect had total MC values above drinking advisory levels. A shift in conditions that would favor MC-LR as the prominent MC congener could quickly contaminate the drinking water supply to nearby citizens. The MC-LR variant showed a lethal dose response in mice at levels 10 to 40 times greater than the MC-RR congener (Zurawell et al., 2005). Late summer blooms in Lake Erie occur when the annual TN:TP input from the Maumee River is low and N is limited (Gobler et al., 2016). Cyanobacterial blooms have been studied to better understand communities with regard to abundance of biomass, the composition of species present, and the ability to produce toxins (Christensen et al., 2019, 2021, 2022; Chorus and Welker, 2021). Christensen et al. (2022) showed that similar water quality metrics from three spatially separate locations on Kabetogama Lake had differences in phytoplankton communities at the same locations.
Additional water quality research is needed to make accurate predictions about toxin levels in any area where cyanobacteria loads are elevated to a level of concern. Informing the public with accurate information on water quality and the presence of cyanotoxins is becoming an ever-increasing need in locations where cyanobacteria persist. As climate conditions shift to higher temperatures for longer periods of time, the danger of HABs producing toxins above the US EPA health advisory drinking limit for adults (1.6 ppb, MC) becomes more of a threat (Wells et al., 2020). The US EPA RUV limit for dogs (0.2 ppb, MC) is much lower, and MC toxins could become a deadly threat to dogs if climate conditions increase toxicity of HABs. Many factors influence the growth and accumulation of cyanobacteria in freshwater environments. Elevated cell counts are an indicator that a harmless HAB could become a toxic HAB. Comparing the dominant species of cyanobacteria in a specific area could indicate how a new HAB might behave relative to existing information on toxic HABs that have been characterized over several seasons. However, a myriad of environmental factors has been shown to influence the growth and accumulation of HABs. These factors influence the production of cyanotoxins from such HABs. Predicting the presence and level of cyanotoxins based solely on the abundance of cyanobacteria requires additional work and careful experimentation.
Chasing the visual clues of a potential toxin producing bloom are challenging due to the spatial complexity and highly variable conditions that can occur in a dynamic water environment (Janssen et al., 2014). Visual clues of a potential HAB location can disappear before samples can be collected or measured. Citizens rely on state sponsored collections and toxin testing or cell count information to be gathered, analyzed, and posted to make decisions about spending time in recreational waters. In some instances, monitoring efforts identify high concentrations of cyanobacteria but do not necessarily provide toxin information. Long-term datasets are needed to study the influence of climate change on the occurrence and severity of HABs (Wells et al., 2020). Remote sensing technologies have been used to gather data and test models related to water quality (Topp et al., 2020). There is a knowledge gap in using this information to turn methods and models into scientific characterization of inland water quality (Topp et al., 2020).
Spatial and temporal differences in water quality measurements highlight the need for new approaches to test water, determine quality, and use these measurements as a proxy to predict the likelihood of harmful toxins in lakes and other aquatic environments. Drones can be used to collect water samples from lakes with a long or even recent history of HABs. The spatial and temporal sampling regime determined at any freshwater lake can be successfully carried out by the DOWSE, provided environmental conditions are suitable to safe drone operations. It is important to note that our sampling of the three lakes in this study was designed to collect water quality data, not to establish a recommended sampling regime for a specific lake. Once a sampling regime has been determined at a specific lake, the DOWSE has the capability to collect water quickly and precisely at any time in any location with line of sight from the collection point. The collection ability of the DOWSE makes it a great tool for lakes that experience persistent HAB conditions since it can be deployed as often as needed, and in specific areas that require intensive sampling approaches. For freshwater lakes that experience HAB conditions seasonally, the DOWSE can be used as needed temporally and can sample in remote or new locations to help elucidate the extent of the HAB across the lake. Our work is important for informing coordinated sampling efforts with uncrewed robotic systems and providing critical and timely information to guide advisory decisions to provide quick and accurate information to citizens and stakeholders.
In conclusion, the sampling methods described here provide a precise and immediate sampling protocol for potentially dangerous surface waters on freshwater lakes. The DOWSE could help elucidate the temporal and spatial distribution of HABs in freshwater lakes that are under visual surveillance. This would allow HAB hazard notifications to be posted and sent to citizens and businesses near the HAB location. The drawbacks include the need for a competent and certified drone pilot, and the need for fair weather during flight operations.
Data availability statement
The raw data supporting the conclusion of this article will be made available by the authors, without undue reservation.
Author contributions
RH and DS conceived, planned, and conducted the field experiments at all of the lakes. RH coordinated and managed analyses for all of the samples, conducted calibration experiments in the laboratory, and analyzed data from all of the experiments. SJ conducted nutrient analyses. JB and JW conducted cyanotoxin analyses. CH assisted with phycocyanin measurements. HG assisted with processing water samples for downstream analyses. AA, HF, SR, and JG-R were part of campaigns at GLSM and Erie. CP designed the drone-based water sampling device. LP, HL, and GB assisted with data collection and analysis for Lake Anna. RH and DS led the writing of the manuscript. All authors provided feedback on the manuscript.
Funding
This research was supported in part by the National Science Foundation (NSF) under grant number NRI-2001119, the Institute for Critical Technology Applied Science at Virginia Tech under grant number ICTAS-178429, and Virginia Tech’s DA-GSS under grant number 177908. Publication fees were provided by Virginia Tech's Open Access Subvention Fund (OASF).
Acknowledgments
We thank Wright State University for coordinating lodging and accommodations for our field campaigns at GLSM. We thank LP for providing lodging and accommodations for our field campaigns at Lake Anna. We thank LP and J. Marsh for the use of their boats at Lake Anna. We also thank members of the Lake Anna Civic Association (LACA) for their ongoing engagement in our work.
Conflict of interest
Authors LP, HL, and GB are members of the Lake Anna Civic Association.
The remaining authors declare that the research was conducted in the absence of any commercial or financial relationships that could be construed as a potential conflict of interest.
Publisher’s note
All claims expressed in this article are solely those of the authors and do not necessarily represent those of their affiliated organizations, or those of the publisher, the editors and the reviewers. Any product that may be evaluated in this article, or claim that may be made by its manufacturer, is not guaranteed or endorsed by the publisher.
Abbreviations
Anatoxin-a (ANA), a neurotoxin produced by cyanobacteria including (but not limited to) Anabaena, Planktothrix, and Raphidiopsis; Chlorophyll a (Chl a), a green pigment found in both cyanobacteria (prokaryotes) and in the chloroplasts of algae (photosynthetic eukaryotes) and plants (eukaryotes); Cyanobacteria, prokaryotic aquatic bacteria that carry out photosynthesis; Cyanotoxins, toxins produced by cyanobacteria; Cylindrospermopsin (CYN), a hepatotoxin and protein synthesis inhibitor produced by cyanobacteria including (but not limited to) Anabaena, Aphanizomenon, and Cylindrospermopsis; Harmful Algal Bloom (HAB), rapid growth of cyanobacteria to levels that can harm people, animals, or the local ecology; Microcystin (MC), a hepatotoxin with many variations, or congeners produced by freshwater cyanobacteria including (but not limited to) Anabaena, Microcystis, and Planktothrix; Nodularin (NOD), a protein phosphatase inhibitor produced by the cyanobacterium Nodularia; Phycocyanin (PC), a protein pigment in cyanobacteria that vary in color from blue to green; Potentially TOXigenic Cyanobacteria (PTOX), cyanobacteria that have the potential to produce various cyanotoxins; Recreational Use Value (RUV), a recommended limit of exposure; Saxitoxin (STX), a neurotoxin and paralytic shellfish toxin that is produced in both marine and freshwater environments by dinoflagellates (eukaryotes) and cyanobacteria (prokaryotes).
References
Anderson, D. (2012). HABs in a changing world: A perspective on harmful algal blooms, their impacts, and research and management in a dynamic era of climactic and environmental change. Harmful Algae 2012 (2012) 2012, 3–17.
Anderson, D. M., Glibert, P. M., and Burkholder, J. M. (2002). Harmful algal blooms and eutrophication: Nutrient sources, composition, and consequences. Estuaries 25 (4), 704–726. doi:10.1007/bf02804901
Ballot, A., Swe, T., Mjelde, M., Cerasino, L., Hostyeva, V., and Miles, C. O. (2020). Cylindrospermopsin- and deoxycylindrospermopsin-producing Raphidiopsis raciborskii and microcystin-producing Microcystis spp. in meiktila lake, Myanmar. Toxins 12 (4), 232. doi:10.3390/toxins12040232
Benson, J., Hanlon, R., Seifried, T., Baloh, P., Powers, C., Grothe, H., et al. (2019). Microorganisms collected from the surface of freshwater lakes using a drone water sampling system (DOWSE). Water 11 (1), 157. doi:10.3390/w11010157
Birbeck, J. A., Peraino, N. J., O’Neill, G. M., Coady, J., and Westrick, J. A. (2019). Dhb microcystins discovered in USA using an online concentration LC-MS/MS platform. Toxins 11 (11), 653. doi:10.3390/toxins11110653
Carlson, R. E. (1977). A trophic state index for lakes1. Limnol. Oceanogr. 22 (2), 361–369. doi:10.4319/lo.1977.22.2.0361
Castendyk, D., Voorhis, J., and Kucera, B. (2020). A validated method for pit lake water sampling using aerial drones and sampling devices. Mine Water Environ. 39 (3), 440–454. doi:10.1007/s10230-020-00673-y
CFR (2022). 40 CFR Part 136 - guidelines establishing test procedures for the analysis of pollutants. Available at: https://www.ecfr.gov/current/title-40/chapter-I/subchapter-D/part-136.
Chorus, I., and Welker, M. (2021). in Toxic cyanobacteria in water: A guide to their public health consequences, monitoring and management. 2nd edn. Second edition (Boca Rataon: CRC Press, an imprint of Informa). doi:10.1201/9781003081449
Christensen, V. G., Maki, R. P., Stelzer, E. A., Norland, J. E., and Khan, E. (2019). Phytoplankton community and algal toxicity at a recurring bloom in Sullivan Bay, Kabetogama Lake, Minnesota, USA. Sci. Rep. 9 (1), 16129. doi:10.1038/s41598-019-52639-y
Christensen, V. G., Olds, H. T., Norland, J., and Khan, E. (2022). Phytoplankton community interactions and cyanotoxin mixtures in three recurring surface blooms within one lake. J. Hazard. Mater. 427, 128142. doi:10.1016/j.jhazmat.2021.128142
Christensen, V. G., Stelzer, E. A., Eikenberry, B. C., Olds, H. T., LeDuc, J. F., Maki, R. P., et al. (2021). Cyanotoxin mixture models: Relating environmental variables and toxin co-occurrence to human exposure risk. J. Hazard. Mater. 415, 125560. doi:10.1016/j.jhazmat.2021.125560
Cotterill, V., Hamilton, D. P., Puddick, J., Suren, A., and Wood, S. A. (2019). Phycocyanin sensors as an early warning system for cyanobacteria blooms concentrations: A case study in the rotorua lakes. N. Z. J. Mar. Freshw. Res. 53 (4), 555–570. doi:10.1080/00288330.2019.1617322
Du, X., Liu, H., Yuan, L., Wang, Y., Ma, Y., Wang, R., et al. (2019). The diversity of cyanobacterial toxins on structural characterization, distribution and identification: A systematic review. Toxins 11 (9), 530. doi:10.3390/toxins11090530
Filippi, M., Hanlon, R., Rypina, I. I., Hodges, B. A., Peacock, T., and Schmale, D. G. (2021). Tracking a surrogate hazardous agent (rhodamine dye) in a coastal ocean environment using in situ measurements and concentration estimates derived from drone images. Remote Sens. 13 (21), 4415. doi:10.3390/rs13214415
Francy, D. S., Brady, A. M., Stelzer, E. A., Cicale, J. R., Hackney, C., Dalby, H. D., et al. (2020). Predicting microcystin concentration action-level exceedances resulting from cyanobacterial blooms in selected lake sites in Ohio. Environ. Monit. Assess. 192 (8), 513. doi:10.1007/s10661-020-08407-x
Fraterrigo, J., and Downing, J. (2008). The influence of land use on lake nutrients varies with watershed transport capacity. Ecosystems 11, 1021–1034. doi:10.1007/s10021-008-9176-6
Gobler, C. J., Burkholder, J. M., Davis, T. W., Harke, M. J., Johengen, T., Stow, C. A., et al. (2016). The dual role of nitrogen supply in controlling the growth and toxicity of cyanobacterial blooms. Harmful Algae 54, 87–97. doi:10.1016/j.hal.2016.01.010
Graham, J. L., Dumbrovsky, N. M., and Eberts, S. M. (2016). Cyanobacterial harmful algal blooms and U.S. Geological Survey science capabilities. Open-File Report 2016-1174. doi:10.3133/ofr20161174
Graham, J. L., Loftin, K. A., Ziegle, A. C., and Meyer, M. T. (2008). Guidelines for design and sampling for cyanobacterial toxin and taste-and-odor studies in lakes and reservoirs. Available at: https://pubs.usgs.gov/sir/2008/5038/pdf/SIR2008-5038.pdf.
Izydorczyk, K., Carpentier, C., Mrówczyński, J., Wagenvoort, A., Jurczak, T., and Tarczyńska, M. (2009). Establishment of an Alert Level Framework for cyanobacteria in drinking water resources by using the Algae Online Analyser for monitoring cyanobacterial chlorophyll a. Water Res. 43 (4), 989–996. doi:10.1016/j.watres.2008.11.048
Jacquemin, S. J., Johnson, L. T., Dirksen, T. A., and McGlinch, G. (2018). Changes in water quality of Grand Lake St. Marys watershed following implementation of a distressed watershed rules package. J. Environ. Qual. 47 (1), 113–120. doi:10.2134/jeq2017.08.0338
Janssen, A. B. G., Teurlincx, S., An, S., Janse, J. H., Paerl, H. W., and Mooij, W. M. (2014). Alternative stable states in large shallow lakes? J. Gt. Lakes. Res. 40 (4), 813–826. doi:10.1016/j.jglr.2014.09.019
Jetoo, S., Grover, V. I., and Krantzberg, G. (2015). The Toledo drinking water advisory: Suggested application of the water safety planning approach. Sustainability 7 (8), 9787–9808. doi:10.3390/su7089787
Koparan, C., Koc, A. B., Privette, C. V., and Sawyer, C. B. (2020). Adaptive water sampling device for aerial robots. Drones 4 (1), 5. doi:10.3390/drones4010005
Kratzer, C. R., and Brezonik, P. L. (1981). A carlson-type trophic state index for nitrogen in Florida lakes. J. Am. Water Resour. Assoc. 17 (4), 713–715. doi:10.1111/j.1752-1688.1981.tb01282.x
Lake Erie Forage Task Group (2020). Report of the lake Erie forage Task Group. Available at: http://www.glfc.org/pubs/lake_committees/erie/FTG_docs/annual_reports/FTG_report_2020.pdf.
Maliaka, V., Lürling, M., Fritz, C., Verstijnen, Y. J., Faassen, E. J., van Oosterhout, F., et al. (2021). Interannual and spatial variability of cyanotoxins in the Prespa Lake area, Greece. Water 13 (3), 357. doi:10.3390/w13030357
Mishra, S., Stumpf, R. P., Schaeffer, B., Werdell, J., Loftin, K. A., Meredith, A., et al. (2021). Evaluation of a satellite-based cyanobacteria bloom detection algorithm using field-measured microcystin data. Sci. Total Environ. 774, 145462. doi:10.1016/j.scitotenv.2021.145462
Ore, J.-P., Elbaum, S., Burgin, A., and Detweiler, C. (2015). Autonomous aerial water sampling. J. Field Robot. 32 (8), 1095–1113. doi:10.1002/rob.21591
Oregon Health Authority (2019). Oregon harmful algae bloom surveillance (HABS) program recreational use public health advisory guidelines cyanobacterial blooms in freshwater bodies. Available at: https://www.oregon.gov/oha/PH/HEALTHYENVIRONMENTS/RECREATION/HARMFULALGAEBLOOMS/Documents/2019%20Advisory%20Guidelines%20for%20Harmful%20Cyanobacterial%20Blooms%20in%20Recreational%20Waters.pdf.
Powers, C., Hanlon, R., and Schmale, D. (2018a). Tracking of a fluorescent dye in a freshwater lake with an unmanned surface vehicle and an unmanned aircraft system. Remote Sens. 10 (2), 81. doi:10.3390/rs10010081
Powers, C., Hanlon, R., and Schmale III, D. G. (2018b). Remote collection of microorganisms at two depths in a freshwater lake using an unmanned surface vehicle (USV). PeerJ 6, e4290. doi:10.7717/peerj.4290
Powers, C. W., Hanlon, R., Grothe, H., Prussin, A. J., Marr, L. C., Schmale, D. G., et al. (2018c). Coordinated sampling of microorganisms over freshwater and saltwater environments using an unmanned surface vehicle (USV) and a small unmanned aircraft system (sUAS). Front. Microbiol. 9, 1668. doi:10.3389/fmicb.2018.01668
Qian, S. S., Chaffin, J. D., DuFour, M. R., Sherman, J. J., Golnick, P. C., Collier, C. D., et al. (2015). Quantifying and reducing uncertainty in estimated microcystin concentrations from the ELISA method. Environ. Sci. Technol. 49 (24), 14221–14229. doi:10.1021/acs.est.5b03029
Ribas-Ribas, M., Battaglia, G., Humphreys, M. P., and Wurl, O. (2019). Impact of nonzero intercept gas transfer velocity parameterizations on global and regional ocean-atmosphere CO2 fluxes. Geosciences 9 (5), 230. doi:10.3390/geosciences9050230
Ross, S. D., Fish, J., Moeltner, K., Bollt, E. M., Bilyeu, L., and Fanara, T. (2022). Beach-level 24-hour forecasts of Florida red tide-induced respiratory irritation. Harmful Algae 111, 102149. doi:10.1016/j.hal.2021.102149
Scheffer, M., Hosper, S., Meijer, M. L., Moss, B., and Jeppesen, E. (1993). Alternative equilibria in shallow lakes. Trends Ecol. Evol. 8 (8), 275–279. doi:10.1016/0169-5347(93)90254-M
Schmale, D. G., Ault, A. P., Saad, W., Scott, D. T., and Westrick, J. A. (2019). Perspectives on harmful algal blooms (HABs) and the cyberbiosecurity of freshwater systems. Front. Bioeng. Biotechnol. 7, 128. doi:10.3389/fbioe.2019.00128
Solitude Lake Management (2022). Algal bloom assessment and recommendations for part of lake Anna. Virginia Department of Health.
Stumpf, R. P., Davis, T. W., Wynne, T. T., Graham, J. L., Loftin, K. A., Johengen, T. H., et al. (2016). Challenges for mapping cyanotoxin patterns from remote sensing of cyanobacteria. Harmful Algae 54, 160–173. doi:10.1016/j.hal.2016.01.005
Thomson-Laing, G., Puddick, J., and Wood, S. A. (2020). Predicting cyanobacterial biovolumes from phycocyanin fluorescence using a handheld fluorometer in the field. Harmful Algae 97, 101869. doi:10.1016/j.hal.2020.101869
Topp, S. N., Pavelsky, T. M., Jensen, D., Simard, M., and Ross, M. R. V. (2020). Research trends in the use of remote sensing for inland water quality science: Moving towards multidisciplinary applications. Water 12 (1), 169. doi:10.3390/w12010169
US EPA (2016). Draft human health recreational ambient water quality criteria and/or swimming advisories for microcystins and cylindrospermopsin. Available at: https://www.federalregister.gov/documents/2016/12/19/2016-30464/request-for-scientific-views-draft-human-health-recreational-ambient-water-quality-criteria-andor.
US EPA (2019). Recommended human health recreational ambient water quality criteria or swimming advisories for microcystins and cylindrospermopsin. Available at: https://www.epa.gov/sites/default/files/2019-05/documents/hh-rec-criteria-habs-document-2019.pdf.
Varner, Mia (2018). Using high frequency monitoring of environmental factors to predict cyanotoxin concentrations in a multi-use, inland reservoir. Varner, Mia: University of Cincinnati ProQuest Dissertations Publishing. Thesis.
VDH (2021). Guidance for cyanobacteria bloom recreational advisory management. Available at: https://www.vdh.virginia.gov/content/uploads/sites/178/2022/01/FINAL_SIGNED_Guidance_for_Cyanobacteria_Recreational_Advisory_Mgt.5Aug2021-1.pdf.
Wells, M. L., Karlson, B., Wulff, A., Kudela, R., Trick, C., Asnaghi, V., et al. (2020). Future HAB science: Directions and challenges in a changing climate. Harmful Algae 91, 101632. doi:10.1016/j.hal.2019.101632
Wilde, F. D., Radtke, D. B., Gibs, J., and Iwatsubo, R. T. (1998). Selection of equipment for water sampling. Environ. Sci. doi:10.3133/TWRI09A2
Yoo, R. S. (1995). Cyanobacterial (Blue-Green algal) toxins: A resource guide. Denver: Waterworks Association Research Foundation.
Keywords: drone (uncrewed/unmanned aerial vehicle), cyanobacteria, cyanotoxin, phycocyanin, freshwater (health/environment), harmful algal bloom (HAB), water sampling methods
Citation: Hanlon R, Jacquemin SJ, Birbeck JA, Westrick JA, Harb C, Gruszewski H, Ault AP, Scott D, Foroutan H, Ross SD, González-Rocha J, Powers C, Pratt L, Looney H, Baker G and Schmale DG (2022) Drone-based water sampling and characterization of three freshwater harmful algal blooms in the United States. Front. Remote Sens. 3:949052. doi: 10.3389/frsen.2022.949052
Received: 20 May 2022; Accepted: 19 July 2022;
Published: 24 August 2022.
Edited by:
Hannah Victoria Herrero, The University of Tennessee, Knoxville, United StatesReviewed by:
Elif Sertel, Istanbul Technical University, TurkeySusannah Leahy, Queensland Government, Australia
Copyright © 2022 Hanlon, Jacquemin, Birbeck, Westrick, Harb, Gruszewski, Ault, Scott, Foroutan, Ross, González-Rocha, Powers, Pratt, Looney, Baker and Schmale. This is an open-access article distributed under the terms of the Creative Commons Attribution License (CC BY). The use, distribution or reproduction in other forums is permitted, provided the original author(s) and the copyright owner(s) are credited and that the original publication in this journal is cited, in accordance with accepted academic practice. No use, distribution or reproduction is permitted which does not comply with these terms.
*Correspondence: David G. Schmale, dschmale@vt.edu